Recession Odds 2026: What the Market Is Pricing
The recession odds 2026 debate is no longer a fringe conversation. Prediction markets, Fed models, and Wall Street research desks are all publishing numbers, and those numbers disagree enough to matter for every portfolio allocation decision you make this year.
We track four indicators at MacroOdds: the live market-implied probability, the NY Fed yield-curve model, the Sahm Rule, and the 10y-2y Treasury spread. Right now, none of them are screaming imminent recession, but none are clean either. The honest answer is that we are in a range where a single bad jobs report or a tariff shock could shift the consensus sharply.
Here is what every number actually means, where the data come from, and why the spread between the gloomiest and most optimistic forecasts is still 30 percentage points wide.
What Are the Recession Odds Right Now?
Prediction markets give us the most real-time read available. As of early June 2026, Polymarket prices a U.S. recession by end of 2026 at roughly 22%, while Kalshi has hovered in the 22-28% range after briefly spiking above 34% in March when oil markets seized up. These numbers move daily, so check the live MacroOdds recession page for the current figure.
What does 22-28% actually mean? It means that the marginal dollar in these markets thinks there is about a one-in-four chance the NBER eventually stamps 2026 as a recession year, or that we see two consecutive quarters of negative real GDP growth between Q2 2025 and Q4 2026. That is not a coin flip, but it is not a near-certainty either.
The volatility in these odds tells its own story. The market ran as low as 18% in February after a decent January jobs print, then sprinted above 34% in March when crude oil crossed 100 and geopolitical noise peaked. It has since settled back into the low-to-mid 20s. Markets are treating this as a genuine probability, not a tail risk.
Recession Probability 2026: What the Models Say
Model-based estimates produce a wider range than prediction markets. The NY Fed yield-curve model, which uses the 10-year minus 3-month Treasury spread run through the Estrella-Mishkin probit framework, currently outputs a 12-month-ahead recession probability in the 18-30% range. The exact reading shifts each month as Treasury rates move.
Moody's Analytics chief economist Mark Zandi has published a 49% probability, noting that a sustained oil price shock or another round of aggressive tariffs could easily push that above 50%. EY-Parthenon puts the figure at 40%. RSM US recently revised down from 40% to 30% after a run of better-than-feared data. Bloomberg's surveyed panel lands near 30%.
The J.P. Morgan research desk has also published recession probability estimates that have tracked higher in 2026 alongside concerns about goods-sector disinflation reversing. The range of 15-49% across credible institutional sources reflects a genuine empirical split, not just noise. No single model has a monopoly on the truth here.
| Source | Recession Probability (12-month) | Methodology |
|---|---|---|
| NY Fed Yield-Curve Model | ~18-30% | Estrella-Mishkin probit, 10y-3m spread |
| Moody's Analytics (Zandi) | ~49% | Macro scenario analysis |
| EY-Parthenon (Daco) | ~40% | Macro scenario analysis |
| RSM US | ~30% | Macro scenario analysis (revised down from 40%) |
| Bloomberg Economist Survey | ~30% | Surveyed forecaster consensus |
| Polymarket (prediction market) | ~22% | Crowd-sourced market prices |
| Kalshi (prediction market) | ~22-28% | Crowd-sourced market prices |
Recession probability estimates by source, June 2026. Prediction-market figures fluctuate daily.
Will There Be a Recession in 2026? The Base Case
The consensus answer is still no, but it is a softer no than it was twelve months ago. Bloomberg analysts project 2.0-2.2% full-year real GDP growth for 2026, supported by AI-driven capital expenditure and a still-functioning labor market. Most major forecasters have not moved recession to their base case.
The bull case rests on three pillars. First, real consumer spending has held up despite elevated inflation near 3.3-3.8%. Second, corporate capital investment in data centers and semiconductor fabs is running hot enough to offset weakness in rate-sensitive sectors. Third, the Fed has room to cut rates if the labor market deteriorates, giving policymakers a meaningful tool they did not have during the 2022 inflation peak.
The bear case is credible too. A 49% recession probability from Moody's is not a fringe view. The concern is that tariff uncertainty is suppressing business investment decisions in ways that do not yet show in hard data, and that the labor market is softening at a pace that historically precedes, rather than coincides with, recessions.
The Yield Curve Recession Signal: Inversion Over, But the Lag Is Real
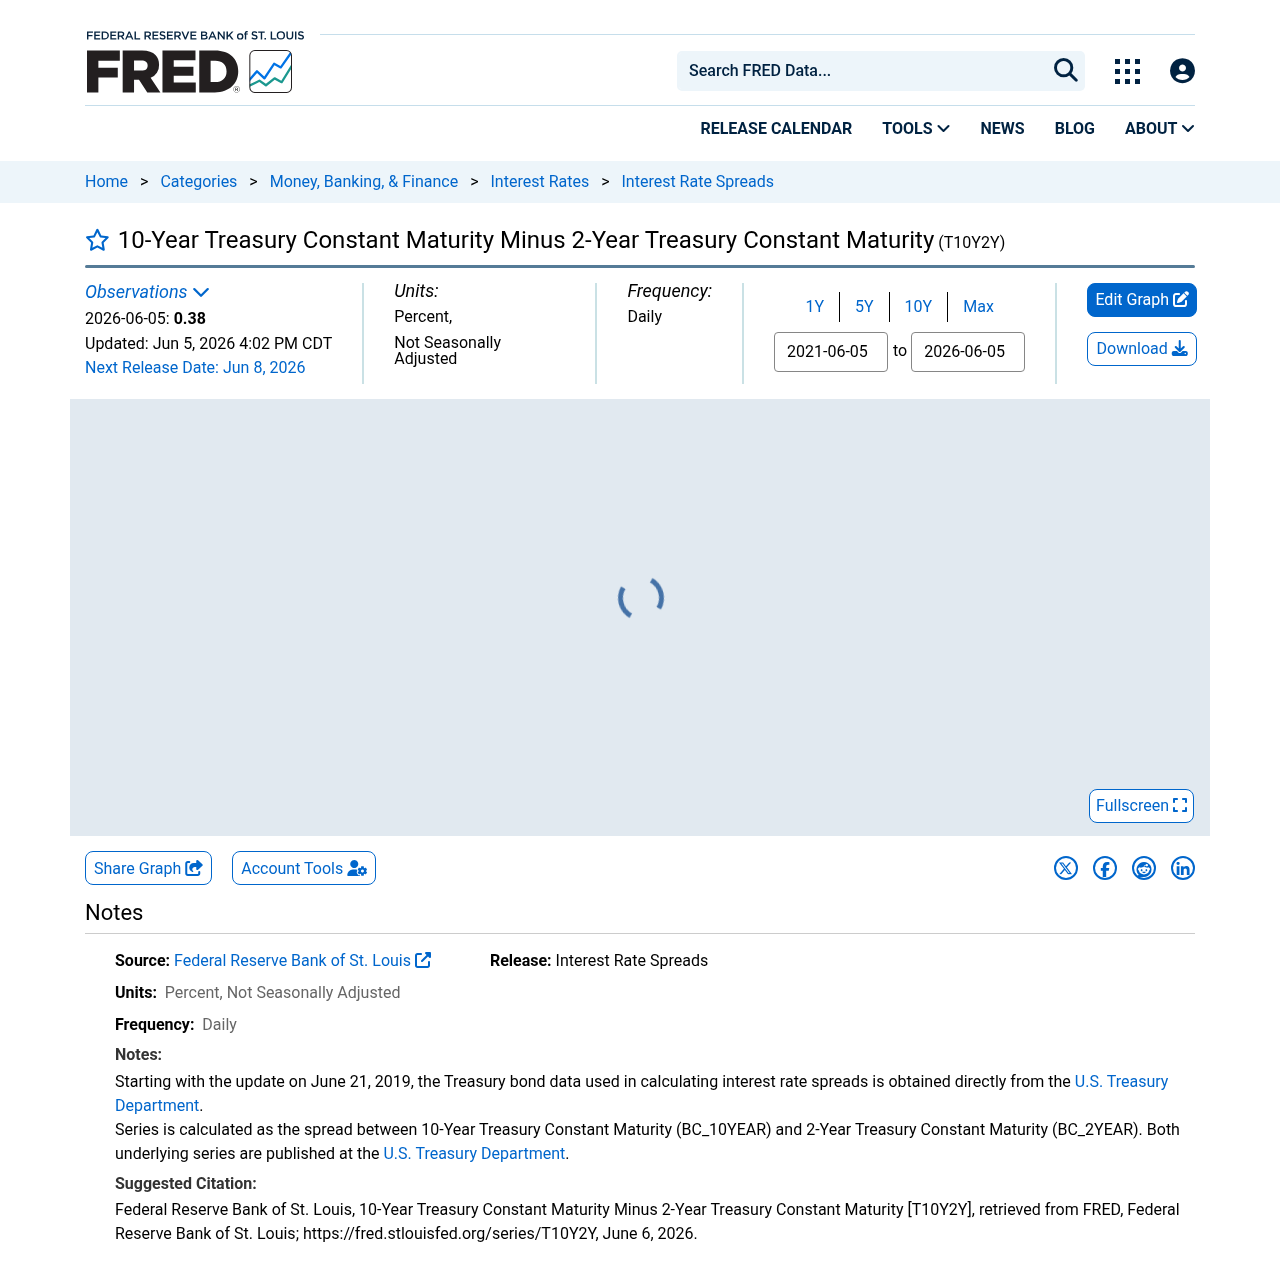
The 10-year minus 2-year Treasury spread re-normalized to positive territory in late 2024 after an inversion that ran from October 2022 through December 2024 -- one of the longest on record. As of June 5, 2026, the 10-year note yielded 4.55% and the 2-year yielded 4.17%, producing a spread of roughly +42 basis points. Track the live spread on FRED.
The re-steepening removes the active warning signal, but here is the critical nuance: yield curve inversions are a leading indicator, not a coincident one. Historical lead times between the curve going negative and a recession starting range from 18 to 92 weeks. The 2022-2024 inversion may still be pulling forward economic weakness that shows up in 2026 GDP data.
The NY Fed's probit model specifically uses the 10-year minus 3-month spread, which behaves slightly differently from the 2s10s. That spread is also positive today but remains compressed enough to keep model recession probabilities elevated relative to the pre-2022 baseline.
The Sahm Rule: Not Triggered, But Worth Watching
The Sahm Rule triggers when the three-month moving average of the national unemployment rate rises by 0.50 percentage points or more relative to the minimum of the three-month averages from the prior 12 months. It has fired during every U.S. recession since 1950, typically about three months in, well before NBER makes its official call.
The real-time FRED reading as of May 2026 is 0.10 percentage points -- well below the 0.50 trigger. But the trend is important context: the reading was 0.30 in January, 0.27 in February, 0.20 in March, 0.13 in April, and 0.10 in May. That is a declining trend over the past five months, which is actually reassuring. Earlier in the year the concern was that momentum was building; instead it has faded. See the real-time data on FRED.
The unemployment rate itself stood near 4.3% as of early 2026. That is elevated relative to the post-pandemic lows, but it is not yet the kind of rapid deterioration the Sahm Rule is designed to catch. The labor market is softening gradually, not collapsing. The distinction matters enormously for whether we tip into recession or achieve a soft landing.
Recession Warning Indicators: The Full Dashboard
No single indicator has a perfect track record. The best practice is to look across multiple signals and ask whether they are converging. Right now, the picture is mixed: some indicators are easing, some are still elevated, and a few are ambiguous.
| Indicator | Current Reading | Threshold / Signal | Status |
|---|---|---|---|
| Sahm Rule (real-time) | 0.10 pp (May 2026) | 0.50 pp = recession signal | Well below trigger, declining |
| 10y-2y Treasury Spread | +42 bps (June 2026) | Negative = inversion warning | Positive, normalized from long inversion |
| 10y-3m Treasury Spread | Positive (compressed) | Negative = NY Fed model warning | Positive but historically compressed |
| NY Fed Yield-Curve Model | ~18-30% (12-month) | Above 30% = elevated caution | Borderline elevated |
| Unemployment Rate | ~4.3% | Rising trend signals risk | Elevated vs. cycle lows, stabilizing |
| Prediction Markets (Polymarket) | ~22% | Above 50% = base-case recession | Elevated but not majority view |
| Bloomberg Economist Survey | ~30% | Surveyed consensus | Elevated, not majority view |
Key recession warning indicators and their June 2026 readings.
The picture is not uniform danger, but it is not all-clear either. We are in a zone where a negative shock -- a tariff escalation, an oil price spike, a credit event -- could tip the balance. The resilience of the baseline depends heavily on the Fed's willingness to respond quickly and the private sector's ability to absorb continued rate pressure.
How Polymarket and Kalshi Price Recession Odds
Prediction markets offer something no model can: a real-time, continuously updated aggregate of informed opinion with real money behind it. Polymarket and Kalshi both run active markets on whether the U.S. enters a recession in 2026, with resolution tied to either two consecutive quarters of negative GDP growth or an official NBER announcement.
The Polymarket and Kalshi figures we cite throughout this piece are snapshots; they move with every data release, every Fed speech, and every geopolitical headline. That is a feature, not a bug. Model-based estimates update monthly or quarterly. Prediction markets update in seconds.
How do they compare to model estimates? Right now, prediction markets are sitting below the model-based consensus of roughly 30%. That is unusual -- markets often price in more tail risk than models. One interpretation is that traders are discounting the scenario where the Fed cuts rates aggressively enough to avert a recession before it starts. Another is that global capital flowing into U.S. assets is keeping a floor under risk sentiment that models do not capture. Visit the live MacroOdds recession page to see the current figure alongside the model-based estimates.
What Could Actually Cause a Recession in 2026?
Recessions rarely announce themselves. The 2008 recession was visible in credit spreads months before GDP turned negative. The 2020 recession arrived in weeks. Understanding the transmission mechanism matters more than reading a probability number.
The three most credible 2026 recession scenarios are: First, a tariff-driven stagflation loop where new import levies push consumer prices higher while simultaneously depressing business investment, forcing the Fed to hold rates higher for longer than the labor market can absorb. Second, a credit tightening shock triggered by stress in commercial real estate or regional bank balance sheets, which reduces lending capacity faster than monetary policy can offset. Third, a geopolitical energy shock, similar to what briefly happened in March 2026, that lifts oil above levels where U.S. consumers and manufacturers absorb it without cutting back.
None of these scenarios is locked in. But each one explains why credible economists are sitting at 30-49% rather than 10%. The base case assumes none of them materialize at full force simultaneously. Check our Fed rate cut probability page for the current market pricing on how aggressively the Fed is expected to respond to any deterioration.
What Recession Odds Mean for Your Portfolio
A 22-30% recession probability is not zero, and it is not a reason to panic. It is, however, a reason to examine the resilience of your current positioning. Historically, recession years see the S&P 500 decline meaningfully on average, but non-recession years with 25% recession odds are often positive for equities as the base case plays out.
Rate-sensitive assets deserve extra scrutiny. The will mortgage rates drop in 2026 question is tightly linked to this recession probability debate -- the Fed only cuts aggressively if the economy deteriorates, which creates a grim trade-off for housing buyers hoping for rate relief. Treasury bonds benefit in a recession scenario as a flight-to-quality trade, but the entry point matters given where yields already are.
Inflation assets are the wildcard. If recession arrives via stagflation rather than demand destruction, traditional hedges like TIPS behave differently than in a clean demand-side downturn. Follow the CPI inflation prediction page for the current market view on whether inflation is cooling fast enough to give the Fed its rate-cut window.
The Bottom Line on Recession Odds 2026
The data as of June 2026 paints a picture of elevated but not alarming recession risk. Prediction markets are pricing roughly one-in-four odds. The Sahm Rule is well below its trigger and declining. The yield curve has re-normalized. The NY Fed model sits in a borderline zone. Wall Street forecasters are clustered around 30%, with outliers on both sides.
That is meaningfully different from the pre-recession signal environment we saw before 2001, 2008, or 2020, where multiple indicators were flashing simultaneously. It is also meaningfully different from the all-clear that marked 2017-2019. We are in genuine uncertainty territory, which demands genuine attention rather than dismissal or panic.
The most useful thing you can do right now is track the Sahm Rule and prediction-market odds together. If the Sahm reading starts climbing back toward 0.30-0.40 and prediction markets tick above 35%, that convergence would be a much stronger signal than any single number today. We publish both in real time at MacroOdds.
Frequently asked questions
What are the odds of a recession in 2026?
As of early June 2026, prediction markets put the probability of a U.S. recession in 2026 at roughly 22-28%. Wall Street economist surveys cluster around 30%, while individual institutional estimates range from about 15% (NY Fed yield-curve model) to 49% (Moody's Analytics). No single number should be taken as definitive, but the range reflects genuine, elevated uncertainty rather than a baseline expectation of contraction.
What is the Sahm Rule and what does it say now?
The Sahm Rule, developed by economist Claudia Sahm, triggers a recession signal when the three-month moving average of the U.S. unemployment rate rises 0.50 percentage points or more above its 12-month low. It has fired during every U.S. recession since 1950. The real-time FRED reading for May 2026 is 0.10 percentage points, well below the 0.50 trigger and declining from a January peak of 0.30.
Does an inverted yield curve mean recession?
A yield curve inversion -- when short-term Treasury yields exceed long-term yields -- has preceded every U.S. recession since World War II. However, the lead time varies widely, from as little as 18 weeks to as long as 92 weeks. The 10y-2y spread inverted from October 2022 through December 2024 and has since re-normalized to roughly +42 basis points. The inversion is over, but the lag risk from that prolonged inversion is not fully resolved.
What does the NY Fed yield-curve model say about recession probability?
The NY Fed's probit model, which uses the 10-year minus 3-month Treasury spread, currently estimates a 12-month-ahead recession probability in the 18-30% range. This model is updated monthly. A reading above 30% is often cited as the threshold for elevated caution; above 50% historically indicated recession was the base case. The current reading sits in borderline territory.
How do Polymarket and Kalshi recession odds work?
Polymarket and Kalshi each run binary contracts on whether the U.S. enters a recession in 2026. The contracts typically resolve to 'Yes' if NBER officially declares a recession or if two consecutive quarters of negative real GDP growth are recorded. Traders buy 'Yes' or 'No' shares, and the price of the 'Yes' share reflects the market-implied probability. These odds update continuously as new data and news arrive.
What would trigger a recession in 2026?
The three most credible scenarios economists cite are: (1) a tariff-driven stagflation loop that forces the Fed to keep rates elevated while consumer demand weakens; (2) a credit tightening shock from stress in commercial real estate or regional banks; and (3) a sustained energy price shock that acts as a tax on consumers and producers simultaneously. None is the base case, but each explains why recession probability estimates are elevated.
How do recession odds affect mortgage rates?
Recession odds and mortgage rates are closely linked through the Fed's policy reaction function. If recession risk rises enough, the Fed typically cuts the federal funds rate aggressively, which pulls down the short end of the curve and eventually mortgage rates. However, if recession arrives via stagflation with persistent inflation, the Fed faces a dilemma that delays rate cuts. See the MacroOdds mortgage rate forecast page for the current market view.
What is the NBER recession definition?
The National Bureau of Economic Research defines a recession as a significant decline in economic activity that is spread across the economy and lasts more than a few months. It is not limited to two consecutive quarters of negative GDP -- the NBER looks at a range of indicators including real income, employment, industrial production, and retail sales. NBER recession calls typically come months after the recession has actually begun.