MacroOdds Blog
Plain-English analysis of the Fed, inflation, recession risk and rates, with the live prediction-market odds and official data behind each call.
2027 FOMC Meeting Schedule: Every Date, Priced
The 2027 FOMC meeting schedule: all eight dates, which ones carry a dot plot, and what Kalshi and Polymarket already price for every 2027 Fed decision.

Federal Reserve Interest Rates 2026: 3.75-4.00%
Federal Reserve interest rates sit at 3.75% to 4.00% after September's hike. Markets price an 86.5% hold on October 28 and a 77.5% December hike.

Unemployment Rate Prediction 2026: 4.2% Holds
Unemployment rate prediction for 2026: U-3 printed 4.2% in September and prediction markets price just 4.85% odds of a 5% reading before year-end.
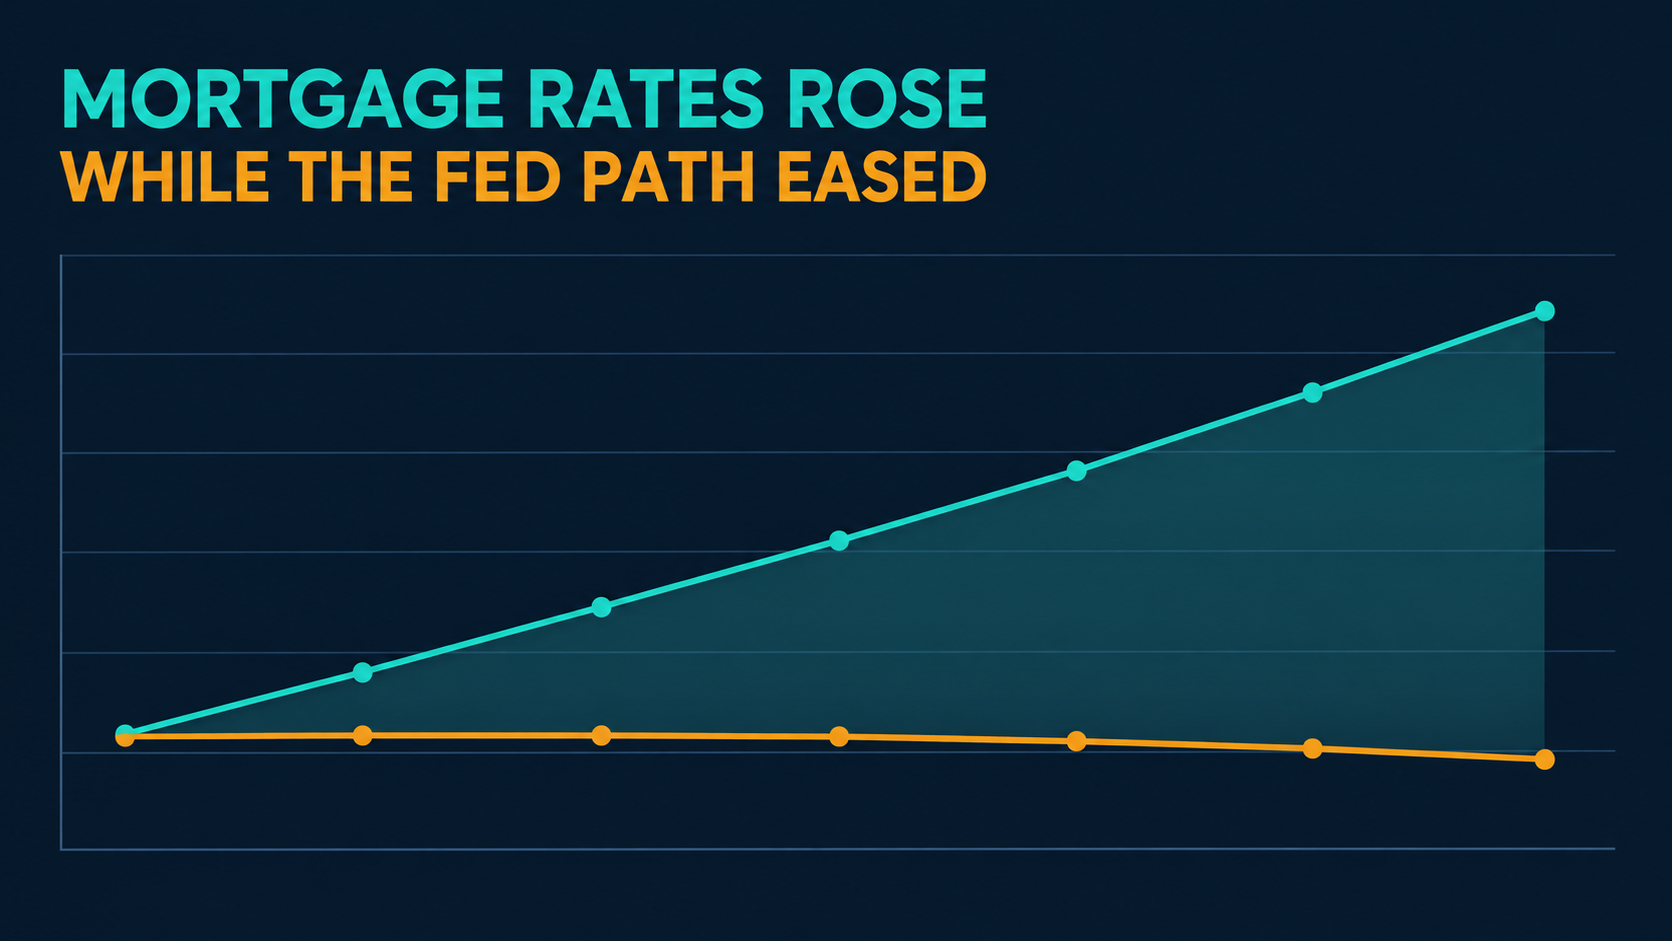
Mortgage Rate Prediction 2026: Markets Say 7.5%
Mortgage rate prediction for 2026: the 30-year fixed hit 7.40% and prediction markets put 68.5% on 7.50% before year-end. Published forecasts say 6.8%.
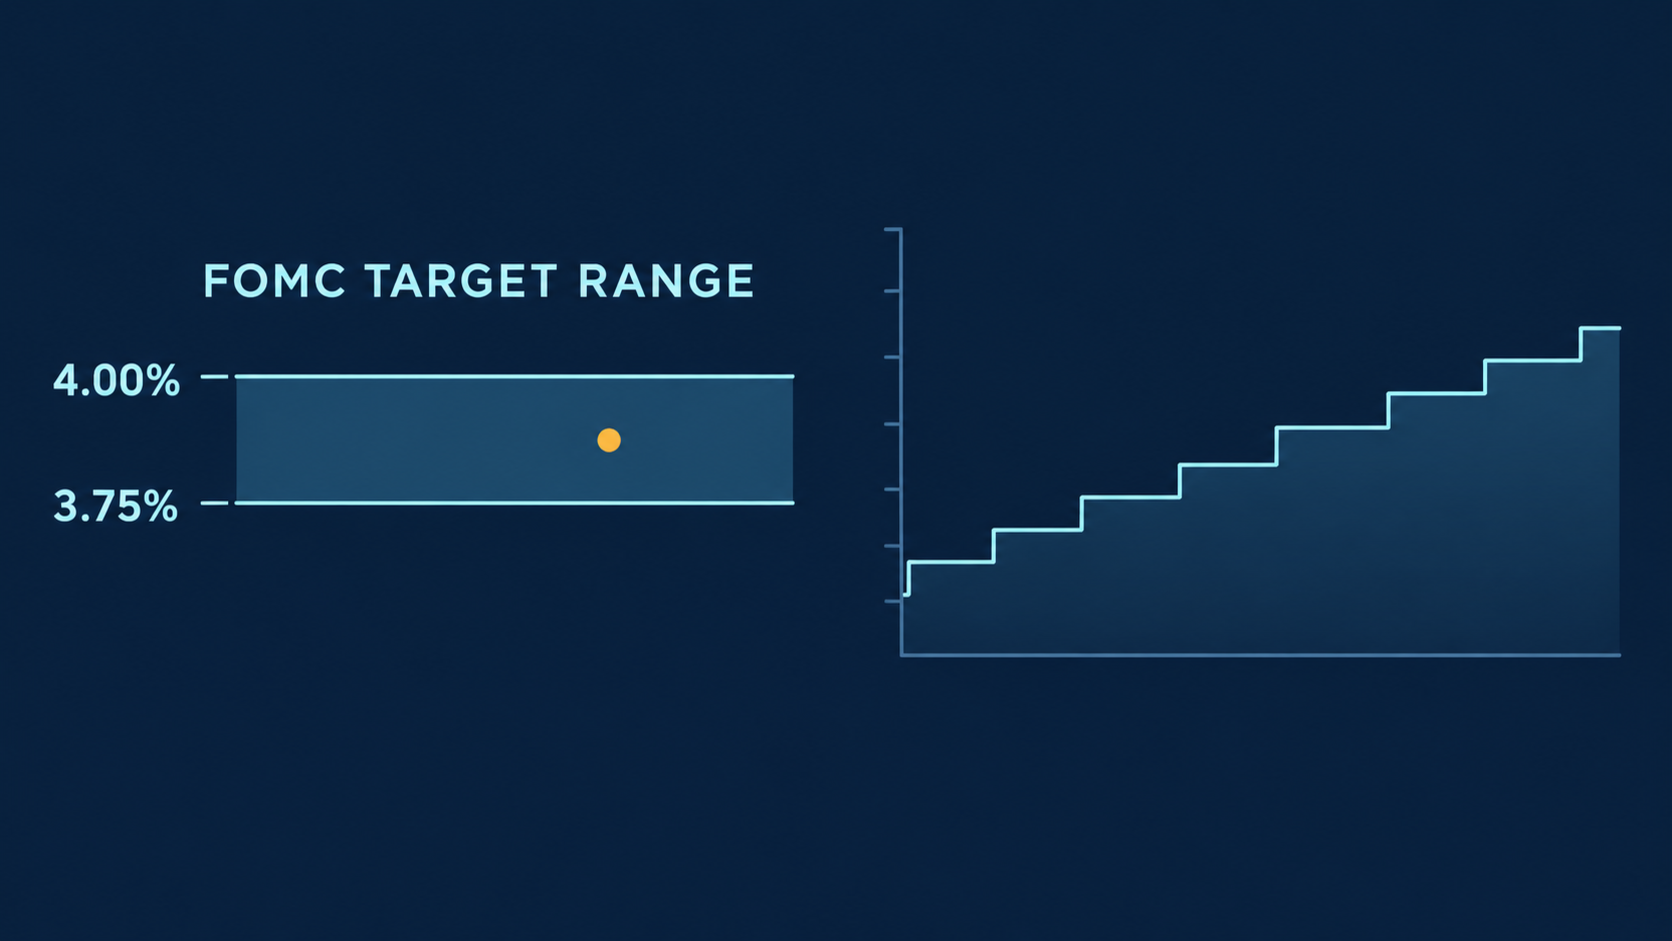
Fed Funds Rate 2026: Target Range and Odds
The fed funds rate is 3.75% to 4.00% after September's hike. Live target range, EFFR, and the odds Polymarket and Kalshi give the December meeting.
Fed Rate Cut Odds October 2026: Just 0.6%
Fed rate cut odds for October 2026 sit at 0.6% on Polymarket. Payrolls came in at 29,000, July turned negative, and the cut contract never moved.

Core PCE Inflation 2026: Markets Say 3.4%
Core PCE inflation is the Fed's preferred gauge. Polymarket and the Cleveland Fed both point to 3.4% for August 2026, out at 08:30 ET on September 30.
Jobs Report Prediction September 2026: 50k-100k
The September jobs report prediction markets price 50k to 100k payrolls and 4.1% unemployment for October 2. Polymarket and Kalshi disagree by 15 points.

CPI Prediction September 2026: Markets Say 3.6%
The CPI prediction market prices a 3.6% headline print for September 2026 on October 14. Polymarket and Kalshi disagree about the upside tail.

Fed Rate Hike Odds October 2026: The Skip Just Flipped
Fed rate hike odds for October 2026 jumped to 56% on Polymarket after the unanimous September hike. Here is the repriced path to the end of the year.

Fed Rate Hike Odds December 2026: Skip, Then Hike?
Fed rate hike odds for December 2026 sit near 60% on Polymarket while October prices as a skip. Here is the full path markets price into year end.

Fed Dot Plot September 2026: What the Dots Will Show
The Fed dot plot lands September 16, 2026. June's median was 3.8%, prediction markets now price 4.06%, and Chair Warsh still refuses to submit a dot.

10-Year Treasury Yield Forecast 2026: Why 4.8% Matters
The 10-year Treasury yield hit 4.80% on September 8, 2026, its highest close since 2023. Here are the forecasts, the real-yield driver, and the Fed odds.

Fed Rate Hike Odds September 2026: Polymarket vs Kalshi
Polymarket prices a September 2026 Fed rate hike at 51.5% and Kalshi at 54%. We break down the odds, the data moving them, and the September 16 decision.

When Will the Fed Cut Rates? 2026 Outlook & Odds
When will the Fed cut rates in 2026? We break down the FOMC schedule, inflation data, prediction-market odds, and what it means for your portfolio.
CPI vs PCE: The Inflation Gauge the Fed Watches
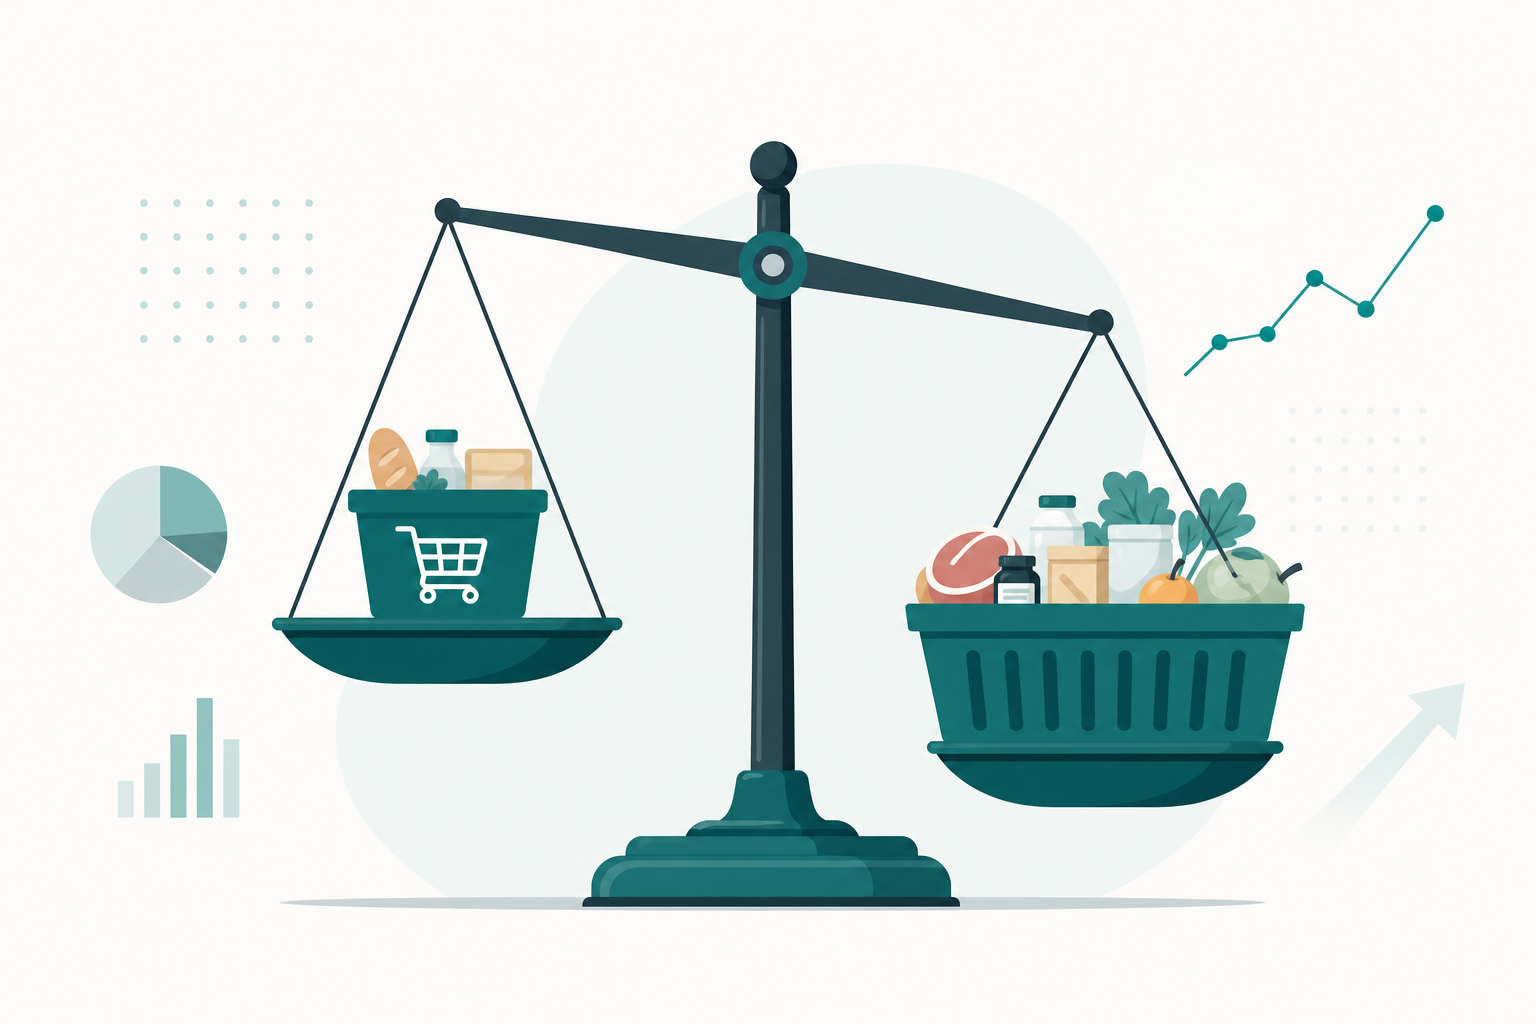
CPI vs PCE explained: why the Fed targets core PCE at 2%, how the two gauges differ on weighting and scope, and what the latest 2026 readings mean for rate policy.
Will Mortgage Rates Drop in 2026? What Markets Say
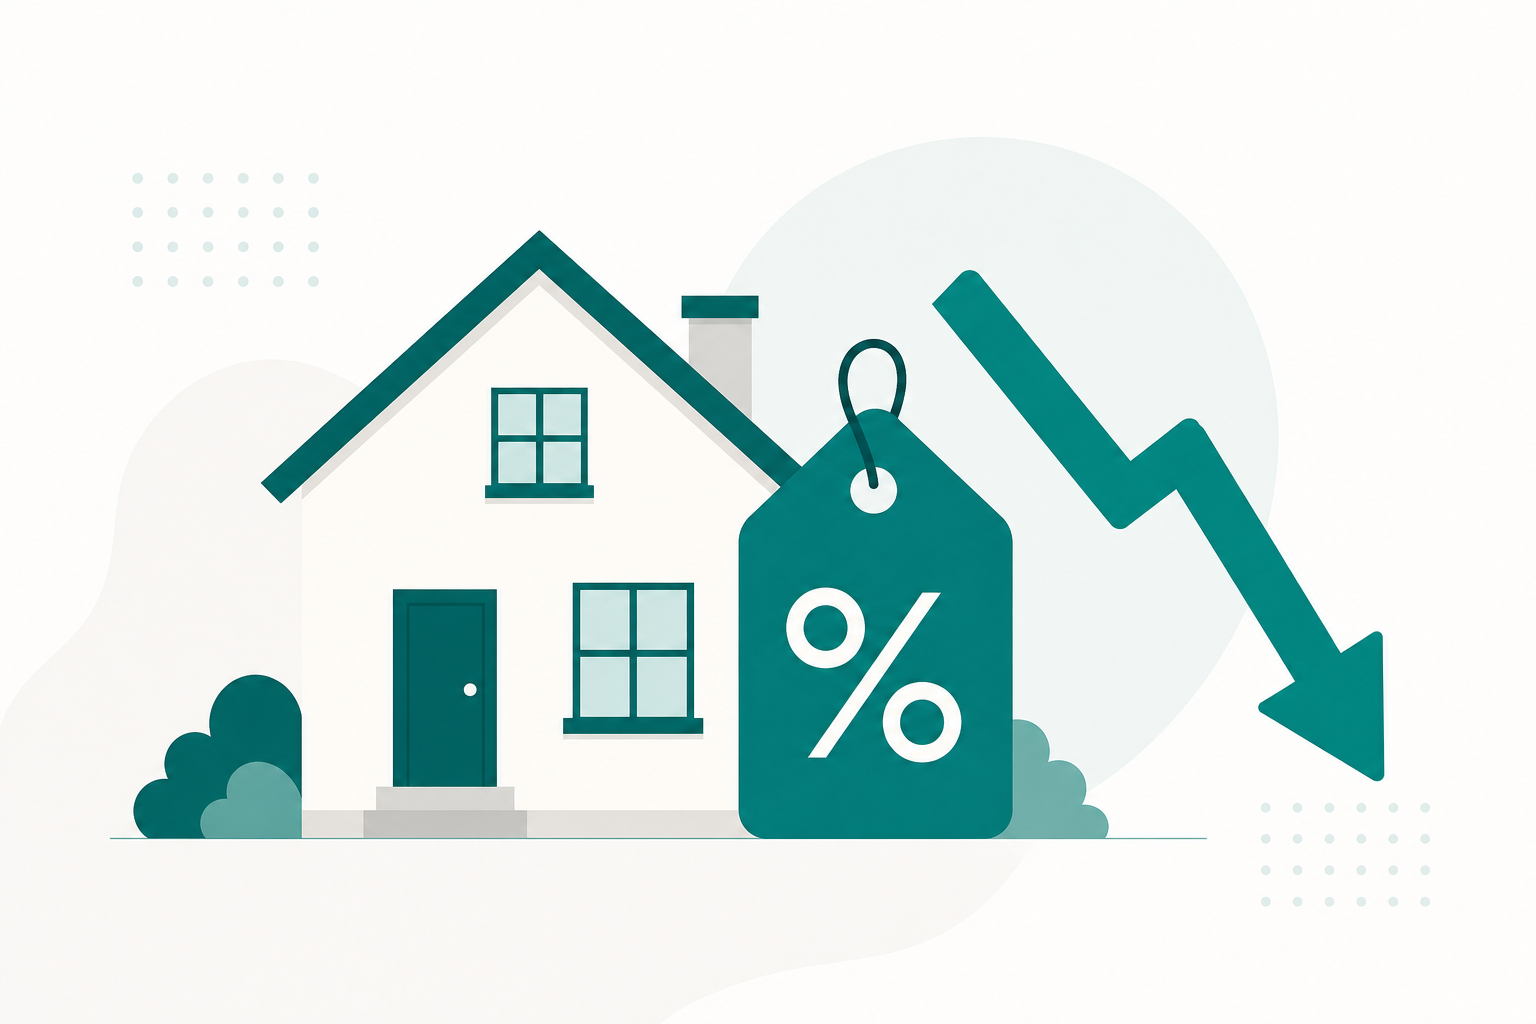
Will mortgage rates drop in 2026? We break down Fed policy, 10-year Treasury dynamics, and what prediction markets say about the path to lower rates.

Who Will Be the Next Fed Chair? 2026 Odds
Who will be the next Fed chair? Kevin Warsh is now confirmed. We track how prediction markets priced the race and what his appointment means for rates.

Recession Odds 2026: What the Market Is Pricing
Live Polymarket odds, NY Fed model readings, the Sahm rule, and yield-curve data all in one place. Here is what the recession odds for 2026 actually say.
What Are Prediction Markets? Polymarket & Kalshi Explained
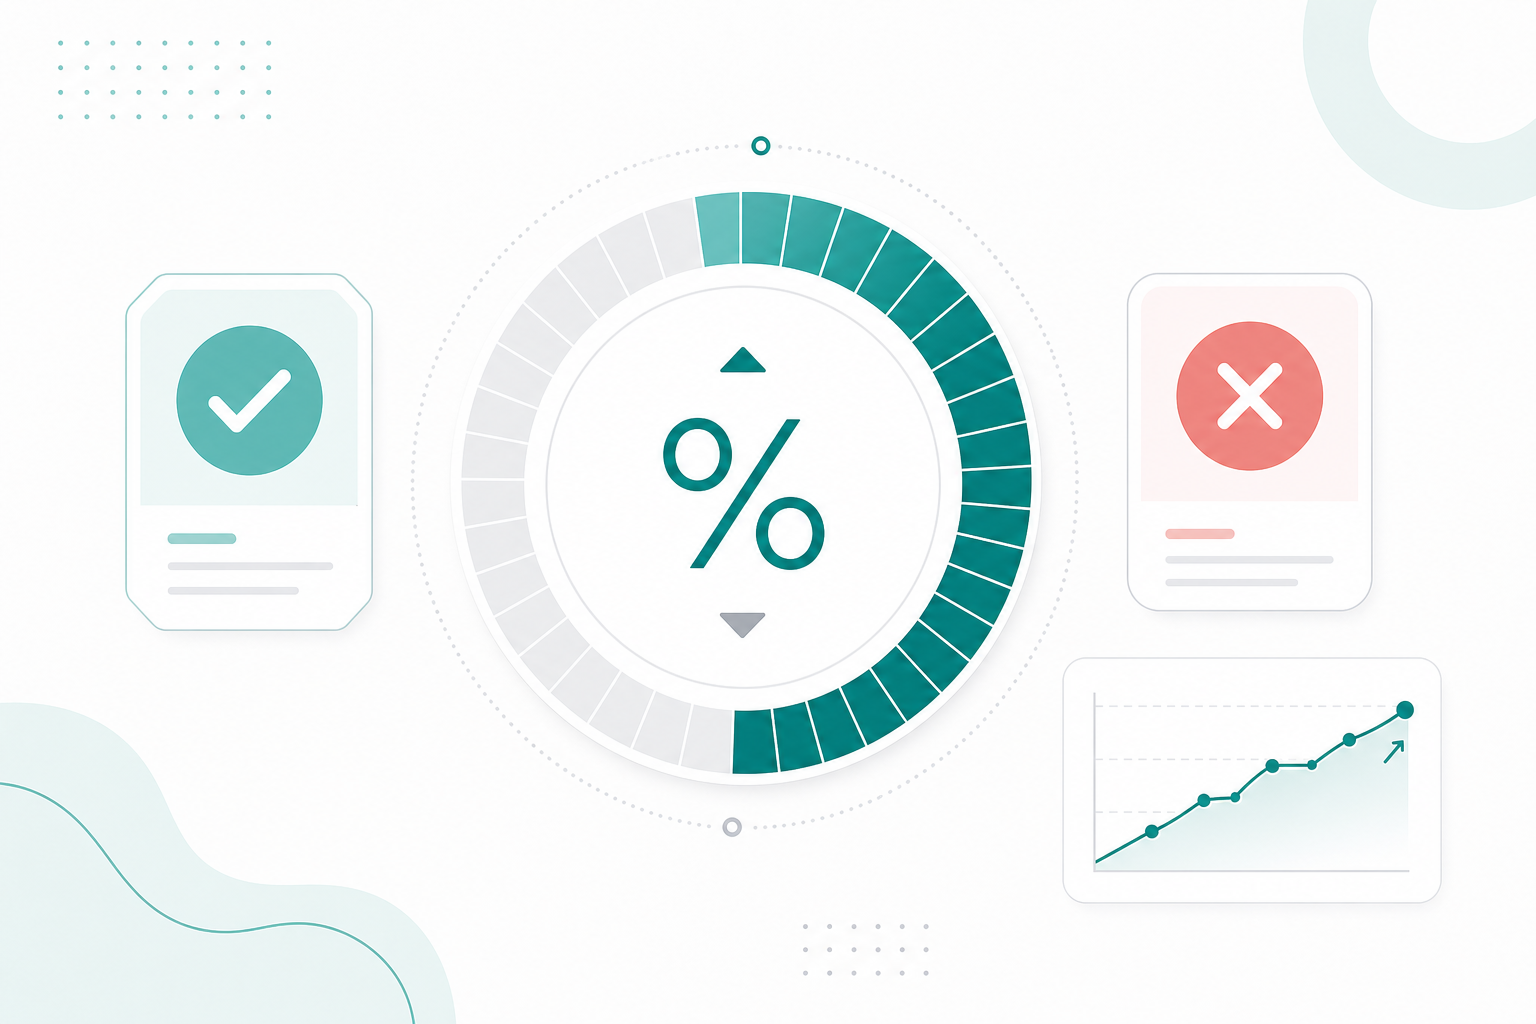
What are prediction markets? We break down how Polymarket and Kalshi turn crowd wisdom into real-time odds on Fed decisions, elections, and more.
US National Debt Explained (2026): How Big Is It?
The US national debt just crossed $39 trillion. We break down who owns it, what it costs to service, and why it keeps pushing interest rates higher.
2026 FOMC Meeting Schedule: Every Date & What Happens
The complete 2026 FOMC meeting schedule: all eight dates, which meetings include the dot plot, what the Fed actually decides, and how to trade around each decision.
What Is an Inverted Yield Curve? Recession Signal
The inverted yield curve has preceded every U.S. recession since 1955. We break down what it means, how to read the 10y-2y spread, and what the 2022-2024 inversion tells us now.
How to Bet on Fed Rate Cuts (2026 Guide)
A step-by-step guide to trading Fed rate cut prediction markets on Polymarket and Kalshi, covering contracts, implied probability, fees, and strategy.