When Will the Fed Cut Rates? 2026 Outlook & Odds
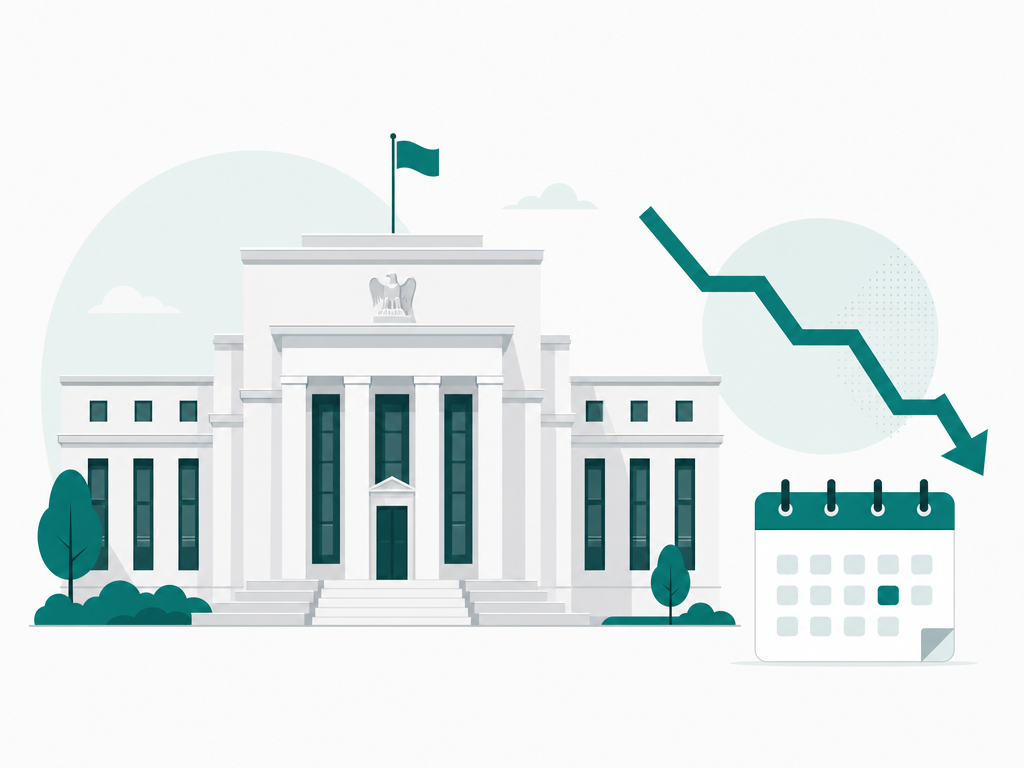
Everybody wants to know when will the Fed cut rates, and almost everybody has been wrong so far in 2026. The Federal Open Market Committee (FOMC) has held the federal funds rate at 3.50-3.75% at every meeting this year, citing inflation that refuses to fall back to the 2% target. For borrowers still paying 7%-plus on mortgages and 20%-plus on credit cards, that stubbornness is costing real money every month.
The frustrating part is that the Fed is not being secretive about its thinking. Chair Powell and the FOMC communicate through press conferences, meeting minutes, and economic projections. The signal is clear: they want to cut, but they need more evidence that inflation is genuinely cooling, not just taking a breather. Understanding what they are watching, and when they could act, puts you ahead of the crowd.
This post maps out every remaining 2026 meeting date, the specific data the Fed needs to see before moving, what prediction markets are pricing right now, and what a rate cut (or a prolonged hold) means for your money. We pull from the Federal Reserve's own statements, FRED data, and live Polymarket and Kalshi odds so you have the full picture in one place.
Where Rates Stand Today and How We Got Here

The Fed's target range of 3.50-3.75% is the product of a long and bumpy policy cycle. The rate was slashed to near-zero in 2020 to cushion the pandemic shock, then hiked aggressively from early 2022 through mid-2023 as inflation hit generational highs above 9%. The Fed pivoted toward cuts in September 2024, trimming rates through the end of 2025 as inflation appeared to be retreating. Then things got complicated.
Geopolitical disruptions pushed energy prices sharply higher in late 2025 and early 2026. Core PCE inflation, the Fed's preferred gauge, climbed to 3.2% in March 2026, well above target. At the April 28-29 meeting, the FOMC voted 8-4 to hold rates steady, the most dissents since October 1992. Four members wanted to move in different directions, which tells you this committee is genuinely split on the path forward.
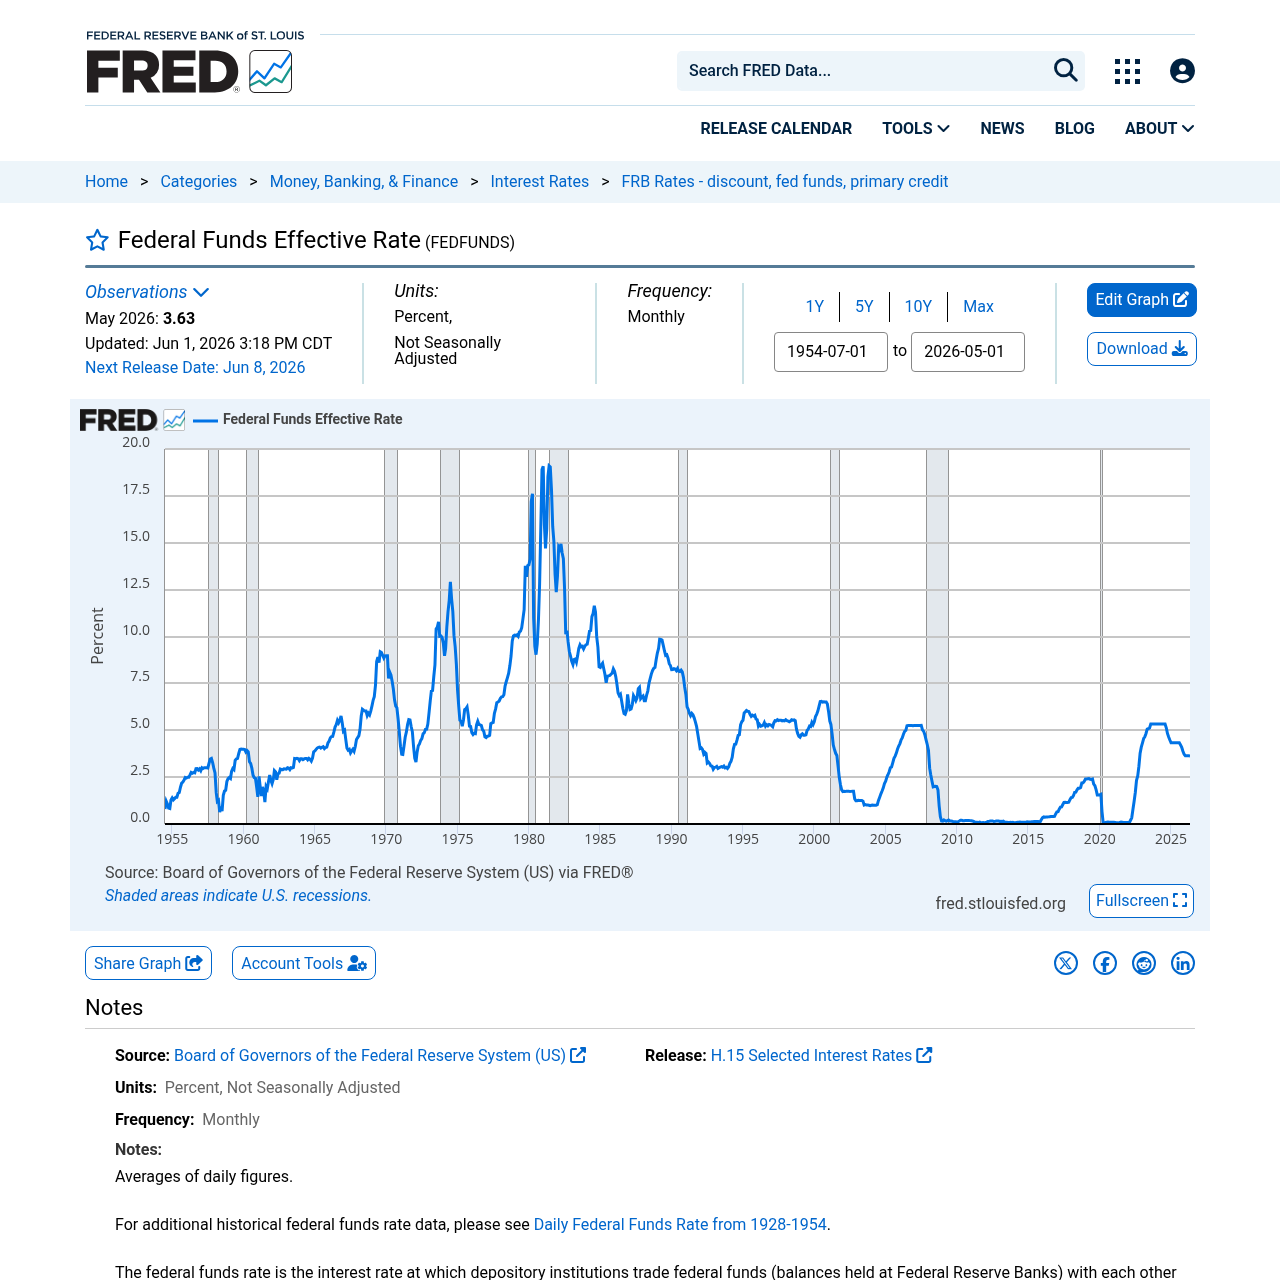
The effective federal funds rate on FRED is the cleanest way to track this history. It shows every cut and hike going back decades and makes plain just how unusual this extended pause is relative to previous cycles. When the Fed finally moves again, that chart will be the first place to confirm it.
The 2026 FOMC Meeting Schedule: Every Date That Matters
The Fed can only change rates at its eight scheduled meetings per year. There are five meetings left in 2026, each one a potential inflection point. The meetings in March, June, September, and December include updated economic projections and the dot plot, making those sessions inherently more market-moving than the off-cycle ones.
| Meeting Dates | Dot Plot? | Market Implied Odds of Cut (as of writing) |
|---|---|---|
| June 16-17, 2026 | Yes | Check live odds at /fed-rate-cut-probability |
| July 28-29, 2026 | No | Check live odds at /fed-rate-cut-probability |
| September 15-16, 2026 | Yes | Check live odds at /fed-rate-cut-probability |
| October 27-28, 2026 | No | Check live odds at /fed-rate-cut-probability |
| December 8-9, 2026 | Yes | Check live odds at /fed-rate-cut-probability |
Remaining 2026 FOMC meetings. Dot-plot meetings carry updated Fed rate forecasts. Source: federalreserve.gov
The June meeting arrives first, on June 16-17, and markets have essentially priced out any cut there. Prediction markets put the probability of a hold at roughly 97-98%, which means traders consider a June move an extreme long shot. The more interesting question is whether September, which comes with a fresh dot plot and three more months of inflation data, is where the Fed finally acts.
October is the meeting most analysts overlook. It falls between two dot-plot sessions and carries no projections, so the Fed rarely likes to move there without the cover of updated forecasts. December, by contrast, is historically the most action-packed meeting of the year. The committee can course-correct the full annual path and set expectations heading into the next year all at once.
The Three Data Points the Fed Is Actually Watching
The FOMC has a dual mandate: maximum employment and stable prices. In practice, when those two goals conflict, inflation almost always wins. Right now they are in mild conflict, which is exactly why the committee is split. The unemployment rate rose to 4.3% in March 2026, above the long-run neutral level most Fed officials peg at around 4.0-4.1%. A softening labor market would normally argue for cuts. But inflation above 3% argues for patience.
The three metrics that will determine the Fed's next move are: core PCE inflation, the monthly jobs report (non-farm payrolls and unemployment), and headline CPI. The Fed watches PCE more closely than CPI, but CPI is released earlier each month and shapes market positioning before PCE arrives. A sustained string of core PCE readings below 2.5% would almost certainly unlock a cut by the September or December meeting.
Energy prices are the wild card for 2026. The spike driven by Middle East developments pushed total PCE to 3.5% in March, well above core. If energy stabilizes or retreats, headline inflation will fall fast, giving the Fed political cover to ease even if core remains stubborn. If energy re-accelerates, the Fed's hands are tied regardless of what happens to jobs. Watch the weekly EIA crude inventories and the monthly import price index as leading indicators.
What Markets Expect vs. What the Fed Is Projecting
There is a widening gap between what the Fed is signaling and what financial markets are pricing. The March dot plot showed two cuts in the next 12 months. But prediction markets like Polymarket and Kalshi are currently pricing a meaningful probability of zero cuts in all of 2026. That divergence is not unusual, it is the normal condition for any rate cycle. Markets tend to price in the pessimistic (fewer cuts) scenario when inflation is elevated because a surprise cut requires more data to justify.
| Scenario | Fed Dot Plot View | Market Pricing (as of writing) | Implied Rate by Dec 2026 |
|---|---|---|---|
| No cuts in 2026 | Minority view (4 of 12 members) | Sizable probability, check /fed-rate-cut-probability | 3.50-3.75% |
| One 25 bp cut | Possible | Moderate probability | 3.25-3.50% |
| Two 25 bp cuts | Median dot view | Lower probability | 3.00-3.25% |
| Three+ cuts | Fringe view | Small probability | Below 3.00% |
Fed projections vs. market pricing for end-2026 rate scenarios. Market odds update daily, see MacroOdds for live figures.
We think the truth lands somewhere between these scenarios: one cut in September or December, conditional on inflation continuing to ease from its March spike. That is the most likely path, not because we are splitting the difference, but because the economic data genuinely points there. The labor market is cooling but not collapsing. Inflation is above target but trending in the right direction if you strip out energy. One cut is consistent with both pieces of the picture.
Prediction markets are extremely valuable here because they aggregate information from thousands of traders who have money on the line. When Polymarket and Kalshi are aligned, that consensus is hard to argue with. When they diverge, it often signals a genuinely contested call. The live MacroOdds page for Fed rate cut probability shows both exchanges side by side so you can see agreement or disagreement in real time.
What Is a Fed Pivot and Why Does It Matter So Much?
A Fed pivot is the moment the central bank shifts from one policy direction to another. The pivot from hiking to holding happened in mid-2023. The pivot from holding to cutting happened in September 2024. We are now in a second holding phase, and the next pivot, whenever it comes, will be from holding back to cutting. Each pivot creates major moves in bonds, stocks, and the dollar.
When the Fed cuts rates, bond prices rise (yields fall), growth stocks and real estate typically rally, and the dollar tends to weaken against other major currencies. Mortgage rates follow Treasury yields rather than the fed funds rate directly, but a cutting cycle generally pulls mortgage rates down over time. For context, mortgage rates fell by roughly 80-100 basis points in the six months after the Fed started cutting in September 2024.
The pivot also matters for recession odds. Historically, the Fed sometimes cuts into a recession rather than ahead of one. The question of whether a 2026 rate cut would be a soft-landing cut (easing from a position of strength) or a recession-response cut (scrambling to support a slowing economy) has very different implications for equity markets. We track those probabilities on the recession odds page if you want to stay ahead of that risk.
How Prediction Markets Price the Fed's Next Move
Polymarket and Kalshi both run continuous markets on Fed decisions. Prices are expressed as probabilities: a contract at 0.25 means the market assigns a 25% chance of that outcome. These markets have outperformed professional forecasters on a number of macro calls in recent years, largely because they aggregate information from a large, diverse crowd with financial skin in the game rather than a handful of analysts with institutional constraints.
For the June 16-17 meeting, prediction markets are essentially unanimous: the Fed holds. Prices near 97-98% for no change. That leaves a small but non-trivial 2-3% chance of a surprise cut, which would be one of the most shocking FOMC decisions in recent memory given the current inflation data. Beyond June, the markets become genuinely interesting. September and December carry meaningful probabilities that shift by several percentage points on each major data release.
You can track these odds, along with related markets on CPI inflation predictions, directly on MacroOdds. We pull from both exchanges and display them together, with historical context so you can see how the odds have moved over the course of the year. When a jobs report or CPI print drops and odds shift by 10 points overnight, that move is the market speaking in plain language.
What a Rate Cut Means for Mortgages, Savings, and Your Portfolio
The practical stakes here are enormous. The 30-year fixed mortgage rate tracks the 10-year Treasury yield, which in turn responds to Fed policy expectations more than to the actual fed funds rate. When markets start pricing in Fed cuts with high confidence, the 10-year yield falls and mortgage rates follow, often before the Fed has moved at all. That is why following prediction-market odds is genuinely useful for anyone considering a home purchase or refinance.
For more on the mortgage angle, our post Will Mortgage Rates Drop in 2026? runs the numbers on what various rate-cut scenarios mean for monthly payments at current price levels. The short version: two 25 bp cuts would take roughly 30-40 basis points off a typical 30-year rate if the Treasury market prices them in ahead of time, which would shave around $100-150 per month off a $400,000 mortgage payment.
Savers face the opposite equation. High-yield savings accounts and money market funds currently pay 4.5-5% in many cases, well above what was available for the decade after the 2008 financial crisis. A cutting cycle compresses those yields. If you are earning meaningful income from cash savings today, a two-cut scenario by year-end would modestly reduce that income but probably not enough to force a major allocation change. A four-cut scenario, which markets currently see as very unlikely, would be more disruptive.
Three Scenarios for the Rest of 2026
Scenario A, the base case: one cut in December. Inflation continues its gradual descent, core PCE falls to around 2.7% by Q4, the labor market softens modestly but does not crack. The Fed cuts once in December, signals more easing in 2027, and markets rally modestly on the confirmation. This scenario requires no new inflation shocks and continued geopolitical calm on energy markets.
Scenario B, the hawkish hold: no cuts in 2026. Energy prices spike again, core PCE re-accelerates above 3.5%, the Fed decides one more year of patience is the right call. Bond yields stay elevated, mortgage rates stay above 7%, and growth stocks face continued pressure from the discounting effect of higher rates. This is the scenario prediction markets currently assign significant weight to.
Scenario C, the dovish surprise: two cuts (September and December). A rapid inflation cool-down, driven by falling energy and a weaker-than-expected labor market, gives the Fed cover to move early. Mortgage rates fall ahead of the cuts as Treasury yields price in the new path. Equities rally broadly and the dollar weakens. This scenario requires either an energy price collapse or a faster-than-expected disinflation in services, where inflation has been stickiest.
How to Follow the Fed in Real Time Without Getting Overwhelmed
The Fed produces a fire hose of communication: press conferences, meeting minutes, the Beige Book, individual speeches from 19 FOMC members, and more. Most of it is noise. The three signals worth actually watching are: the post-meeting statement (the official policy decision), the dot plot (updated four times per year), and the Fed chair's press conference. Everything else is commentary.
For meeting-by-meeting decisions, the prediction markets are the most efficient summary of all available information. When the June 16-17 statement lands at 2 p.m. Eastern, Polymarket prices will react within seconds to any surprise language. The market is reading the statement faster than any human and pricing the implications instantly. MacroOdds embeds those live prices on the fed rate cut probability page so you can watch the reaction without having to monitor two exchanges.
For the longer-term view, the dot plot is the single most information-dense document the Fed publishes. The March 2026 edition showed four members expecting no cuts through end-2026, the rest split between one and two cuts. The June 2026 dot plot, released alongside the June 16-17 decision, will update those projections with three more months of data baked in. Watch whether the median shifts toward fewer cuts or stays at two.
Frequently asked questions
Will the Fed cut rates in 2026?
The Fed has held rates steady at 3.50-3.75% through the first half of 2026. The March dot plot showed most FOMC members expecting one or two cuts by year-end, but prediction markets are pricing a significant chance of zero cuts given persistent inflation above 3%. The most likely scenario, based on current data and market pricing, is one cut in September or December if inflation continues to ease.
When is the next FOMC meeting?
The next FOMC meeting is June 16-17, 2026. It includes updated economic projections and a dot plot. After that, meetings are scheduled for July 28-29, September 15-16, October 27-28, and December 8-9. The Federal Reserve confirms each meeting date at the preceding meeting.
What is a fed pivot?
A Fed pivot is the moment the central bank shifts from one policy direction to another. The most recent pivot was from holding rates steady to cutting in September 2024. The current pivot question is whether the Fed will shift from its 2026 holding pattern back toward cutting. Pivots typically drive large moves in bonds, equities, and the dollar.
What does the fed funds rate affect?
The fed funds rate is the overnight rate banks charge each other to lend reserves. It directly sets the floor for credit card rates, home equity lines of credit, and adjustable-rate mortgages. It indirectly influences fixed mortgage rates and longer-term bond yields by shaping expectations for future short-term rates. When the fed funds rate falls, borrowing costs across the economy generally follow.
How do Polymarket and Kalshi price Fed rate decisions?
Polymarket and Kalshi let anyone trade contracts that pay out based on the outcome of Fed decisions. A contract priced at 0.15 implies a 15% market probability of that outcome. Prices update in real time as economic data arrives and as Fed officials speak. Prediction market odds have historically tracked closely with CME FedWatch tool probabilities derived from interest rate futures.
Why hasn't the Fed cut rates despite slowing growth?
The Fed has a dual mandate: maximum employment and stable prices. With core PCE inflation at 3.2% in March 2026, well above the 2% target, the Fed is prioritizing price stability even as the unemployment rate edges up to 4.3%. The committee believes cutting too soon risks reigniting inflation, as happened in the 1970s when the Fed eased prematurely. They want clear, sustained evidence that inflation is returning to target before moving.
What happens to mortgage rates if the Fed cuts?
Mortgage rates track the 10-year Treasury yield rather than the fed funds rate directly. But a Fed cutting cycle generally pulls 10-year yields lower as markets reprice the path of future short rates. In the 2024 cutting cycle, mortgage rates fell roughly 80-100 basis points in the six months after the Fed began cutting. Markets often price in cuts ahead of time, so mortgage rates can fall before the Fed formally acts.
What is the dot plot?
The dot plot is an anonymous chart released four times per year alongside FOMC meetings, in March, June, September, and December. Each dot represents one committee member's forecast for where the fed funds rate will be at year-end for the current year, next year, and the year after. It is the clearest window into where individual members think rates are heading and how split or aligned the committee is.