CPI vs PCE: The Inflation Gauge the Fed Watches
Every month, two government agencies publish inflation numbers that rarely agree, and the gap between them shapes everything from Fed policy to your mortgage rate. CPI vs PCE is not just an academic debate about index methodology. It is the single most important data question in macro right now: which gauge tells the Fed it is close enough to its 2% target to cut rates, and which one keeps printing high enough to hold them steady?
In April 2026, headline CPI came in at 3.8% year-over-year. Core PCE, the measure the Fed actually uses, printed at 3.3%. Both are materially above the 2% target, but the 50 basis-point gap between them is not a rounding error. It reflects genuine structural differences in how the Bureau of Labor Statistics and the Bureau of Economic Analysis define, scope, and weight a consumer price basket. Knowing why they diverge tells you more about the inflation debate than any single data point.
We will walk through each difference, show you exactly why Jerome Powell watches PCE and not CPI, and explain how live odds on MacroOdds translate these monthly prints into a real-time probability that the Fed moves at its next meeting.
What Is CPI and What Does It Actually Measure?
The Consumer Price Index is produced by the Bureau of Labor Statistics and has been published in its modern form since the early 1900s. It tracks the average price change that urban households pay for a fixed basket of goods and services. The BLS surveys roughly 80,000 items each month across 23,000 retail and service outlets, weighting the basket based on household expenditure surveys collected over the prior two years.
The CPI universe covers urban consumers, which the BLS estimates at about 93% of the U.S. population. What it does not cover is significant: rural households, government-paid medical care (Medicare and Medicaid), and employer-paid health insurance premiums. If your insurance company charges your employer $900 a month for your coverage and the premium rises 10%, CPI records none of that increase.
The BLS updates CPI weights annually. That annual lag matters because the formula is a modified Laspeyres index: it holds a relatively fixed basket and does not immediately account for consumers shifting away from items whose prices spike. When beef prices surge and shoppers pivot to chicken, CPI keeps measuring at beef-level weights longer than consumers actually spend there. This structural feature is one of several reasons CPI consistently runs higher than PCE.
What Is PCE and Why Is It Broader?
The Personal Consumption Expenditures price index is produced by the Bureau of Economic Analysis as a byproduct of its National Income and Product Accounts. PCE does not survey households. It surveys businesses. The BEA pulls data from retail trade reports, service sector surveys, and IRS tax records to estimate what consumers spent across the entire economy, including spending done on their behalf by third parties.
That distinction is fundamental. PCE captures the full cost of healthcare delivered to Americans: what you paid out-of-pocket, what your employer contributed, and what Medicare and Medicaid paid on your behalf. Healthcare in the U.S. is roughly a fifth of GDP. When PCE covers that spending and CPI largely does not, the two indexes are measuring materially different things.
PCE also uses a chain-type Fisher Ideal formula, which updates weights monthly to reflect actual current spending patterns. When consumers substitute cheaper goods for expensive ones, PCE captures that substitution almost immediately. The result is an index that is more responsive to real behavior and, structurally, prints lower than CPI over most time horizons.
The BEA releases the PCE price index as part of its monthly Personal Income and Outlays report, typically about two weeks after the BLS releases CPI. Because PCE is released second and covers the prior month, markets get CPI first and then recalibrate when PCE confirms or departs from it. That sequencing matters for anyone trading fed rate cut probability markets.
PCE vs CPI: The Five Differences That Matter Most
| Dimension | CPI | PCE |
|---|---|---|
| Produced by | Bureau of Labor Statistics (BLS) | Bureau of Economic Analysis (BEA) |
| Population covered | Urban households (~93% of U.S.) | All U.S. residents, including rural |
| Data source | Household expenditure surveys | Business sales and tax records |
| Weighting formula | Modified Laspeyres (fixed, annual update) | Chain-type Fisher Ideal (flexible, monthly update) |
| Shelter weight | ~34% of total index | ~16% of total index |
| Healthcare coverage | Only out-of-pocket spending | Out-of-pocket + employer-paid + Medicare/Medicaid |
| Consumer substitution | Slow to adjust for substitution | Adjusts monthly for substitution |
| Typical inflation reading | Runs ~0.3-0.5 pp higher than PCE | Runs ~0.3-0.5 pp lower than CPI |
| Fed target basis | Not the Fed's primary target | Fed's official 2% target gauge |
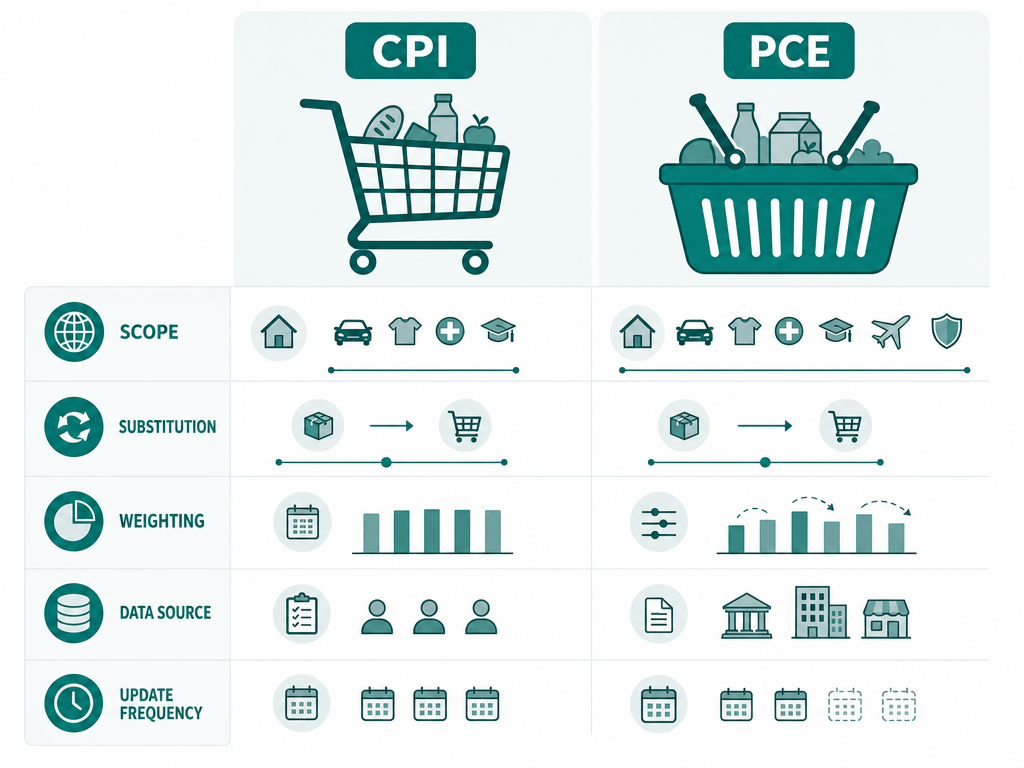
Side-by-side comparison of CPI and PCE methodology (BLS and BEA, 2026)
The shelter gap alone explains most of the persistent divergence you see in any given month. When rent growth is running hot, as it was through most of 2022 and 2023, CPI's heavier shelter weight amplifies that signal. PCE gives you a more diluted read of the same rent surge because housing is a smaller share of its basket. Neither index is wrong. They are measuring different things and answering slightly different questions.
The consumer substitution effect is less visible but equally important over longer horizons. Academic research from the BLS itself has found that the substitution bias in the Laspeyres formula adds roughly 0.3-0.4 percentage points to CPI relative to a fully chain-weighted index. PCE's monthly Fisher weighting eliminates virtually all of that bias.
What Inflation Does the Fed Target, and Why Core?
The Federal Reserve formally adopted PCE as its inflation target in January 2012, when the Federal Open Market Committee published its first Statement on Longer-Run Goals and Monetary Policy Strategy. The statement set a 2% longer-run inflation target based on the PCE price index. Before 2012, the Fed had been informally shifting toward PCE since roughly 2000, but the 2012 document made it official and quantitative.
The Fed chose PCE for three stated reasons. First, broader coverage: PCE better reflects what Americans actually spend money on, including the healthcare spending that is increasingly central to household budgets. Second, the chain-weighting methodology is more methodologically sound because it adapts to real consumer behavior. Third, PCE tends to be revised less dramatically after the fact, which matters when you are setting policy based on the most recent print.
The "core" designation, which strips out food and energy, gets added on top because food and energy prices are volatile and largely supply-driven. A drought in the Midwest or an OPEC decision in Riyadh can move headline PCE by a full percentage point in a single month without telling you anything meaningful about the underlying demand-side inflation pressure that monetary policy can actually address. Core PCE is the signal; headline PCE is the noise plus the signal.
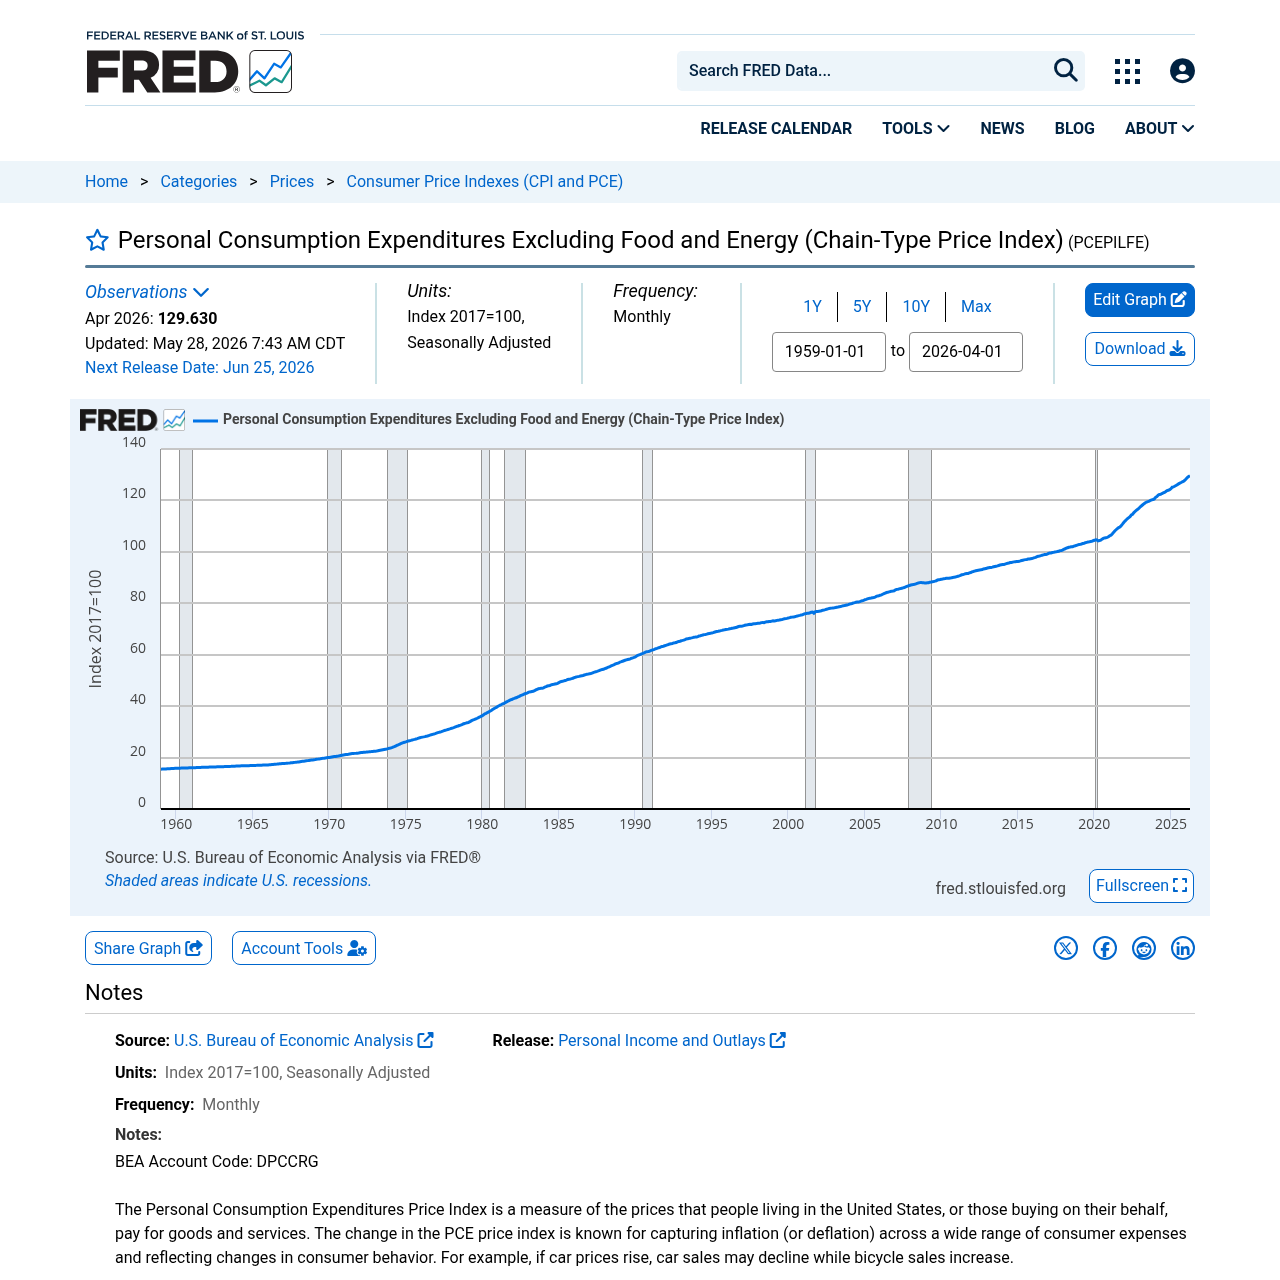
The Latest 2026 Readings: Where Do We Stand?
The April 2026 data puts the inflation picture in sharp relief. The BLS reported that headline CPI rose 3.8% year-over-year in April, accelerating from 3.3% in March. Core CPI, excluding food and energy, ran at 2.8%. Over at the BEA, the April PCE report released May 28 showed headline PCE at 3.8% and core PCE at 3.3%, both matching analyst expectations on an annual basis but with month-over-month core PCE at +0.2%, softer than the +0.3% forecast.
The gap between core CPI (2.8%) and core PCE (3.3%) this month is actually inverted from the usual pattern, driven in part by how healthcare services and financial services are priced in the PCE relative to their CPI equivalents. It is a reminder that the two indexes can diverge in either direction in any given month even when the structural drivers point one way over time.
| Metric | March 2026 | April 2026 | Gap vs 2% Target |
|---|---|---|---|
| Headline CPI (YoY) | 3.3% | 3.8% | +1.8 pp |
| Core CPI (YoY) | Not published in summary | 2.8% | +0.8 pp |
| Headline PCE (YoY) | ~3.1%* | 3.8% | +1.8 pp |
| Core PCE (YoY) | ~2.7%* | 3.3% | +1.3 pp |
| Core PCE (MoM) | +0.3% | +0.2% | Slightly below forecast |
| Fed target (core PCE) | 2.0% | 2.0% | Benchmark |
Key inflation readings, BLS and BEA official data
* March PCE figures are approximate based on BEA monthly revisions. The authoritative source for all readings is BEA Personal Income and Outlays and BLS CPI.
PCE Index vs CPI: What Each Release Moves in Markets
CPI is the market-moving print. It drops mid-month, two weeks before PCE, and it has the larger immediate impact on short-term rates, equity volatility, and the dollar. The reason is simple: timing and familiarity. Traders have been watching CPI since the 1970s, Bloomberg terminals blast the number the moment it hits, and the surprise relative to consensus carries enormous weight in algorithmic positioning.
PCE is the policy-moving print. Because the Fed has formally committed to a PCE target, every dot plot, every press conference question, and every Fed governor speech references the distance between core PCE and 2%. A CPI surprise that is not confirmed by PCE two weeks later loses its policy relevance quickly. A PCE surprise, on the other hand, directly reprices rate expectations for the current cycle.
This dynamic is exactly what prediction markets price. Platforms like Polymarket and Kalshi run active markets on each monthly CPI and PCE print, letting traders bet on whether the number comes in above or below the median economist estimate. The crowd-sourced probabilities on those markets often deviate meaningfully from Wall Street consensus, and the MacroOdds inflation page tracks those odds in one place. When you check fed rate cut probability, the underlying driver is almost always the last core PCE reading.
Core PCE Inflation and the Rate Policy Transmission Mechanism
Understanding the mechanics matters because the Fed does not simply cut or hike when inflation hits a number. It manages expectations about the future path of prices. When Fed Chair Powell says the committee is "data dependent," the data he means is primarily core PCE, supplemented by the employment report and, increasingly, measures like the Dallas Fed Trimmed Mean PCE which strips out the most volatile components of the index each month.
The transmission works like this: core PCE prints come in high, long-term rates rise as markets price a higher-for-longer Fed, mortgage rates tick up, housing demand softens, corporate borrowing costs increase, and investment slows. That chain of causation runs backward when PCE moderates. A single 0.1 percentage point surprise in core PCE can move two-year Treasury yields by 5-10 basis points on the day of the release, which ripples into every asset class within hours.
For retail investors, the practical implication is clear. Before each PCE release, check where prediction markets are pricing the print relative to economist consensus. If the market is pricing a higher surprise than Wall Street, bond prices may already be falling. If PCE comes in below the market-implied expectation, you can expect a swift rally in Treasuries and rate-sensitive equities. The when-will-the-fed-cut-rates analysis we published last month walks through the scenario analysis in detail.
The Shelter Problem: Why CPI and PCE Keep Disagreeing
The biggest single driver of the persistent CPI-PCE gap over the past three years is shelter inflation, specifically the way CPI measures rent through its Owners Equivalent Rent component. OER asks homeowners to estimate what they would pay to rent their own home. It is a survey-based, lagged measure that notoriously takes 12-18 months to reflect actual market rents, which means CPI shelter inflation was still running hot in 2024 even after Zillow and Apartment List data showed market-rate rents flattening.
PCE handles shelter differently. Because shelter is only about 16% of the PCE basket versus 34% in CPI, a surge in OER simply has less structural leverage in PCE. More importantly, PCE includes imputed rental income for owner-occupied housing in a way that dilutes the shelter signal further. The net effect is that when housing costs run hot, CPI amplifies the signal and PCE mutes it. When housing cools, CPI takes longer to show it.
This shelter-driven wedge is one reason some economists have argued the Fed's 2% PCE target is easier to hit than a hypothetical 2% CPI target would be. The counterargument is that shelter costs are a real and large part of household budgets, and measuring them conservatively in PCE may understate the inflation burden that consumers actually feel. Both arguments have merit, and the recession odds 2026 analysis depends significantly on which view dominates Fed thinking as the year progresses.
How to Use Both Gauges Together as a Macro Trader
The CPI and PCE are not rivals. They are complements, each giving you a different slice of the same underlying price pressure. A useful mental framework: CPI tells you what urban households feel in their wallets; PCE tells you what the Fed is watching on its dashboard. When the two diverge sharply, the gap itself is the signal.
A wide positive gap, where CPI runs materially above PCE, often points to shelter or used-car price spikes that are showing up in household budgets but not fully in the Fed's preferred measure. In that environment, the Fed may appear more dovish than the headlines suggest. A rare scenario where PCE runs above CPI, as we saw partially in early 2026, often reflects healthcare or financial services cost acceleration that the household survey misses. In that environment, the Fed's actual policy response may be tighter than market participants conditioned on CPI alone expect.
Track both releases, compare them against prediction market expectations on MacroOdds, and build your rate-path thesis from the PCE trend rather than the CPI headline. That is how the Fed builds theirs.
Is PCE Higher or Lower Than CPI? The Historical Record
Over the long run, PCE has consistently run below CPI. The Federal Reserve Bank of Cleveland and the BLS have both published research finding the average gap at roughly 0.3 to 0.5 percentage points annually over multi-decade periods, driven primarily by the substitution bias in the Laspeyres CPI formula and the heavier shelter weight. There are individual months where PCE exceeds CPI, but the structural tendency runs the other direction.
The implication for the 2% target debate is not trivial. If the Fed had set its target against CPI instead of PCE, a 2% CPI target would be roughly equivalent to a 1.5-1.7% PCE target. The Fed is, in practice, allowing slightly more inflation than a CPI-centric framework would suggest. Some critics argue this is intentional: a PCE-based target gives the Fed marginally more room to run the economy hot before tightening. Others argue it is simply a better measurement choice with no political motivation.
Frequently asked questions
Which is better, CPI or PCE?
Neither is objectively better. CPI better captures what urban households experience in their daily spending because it is survey-based and focuses on out-of-pocket costs. PCE is more comprehensive, covering a broader population and including spending on behalf of consumers like employer-paid healthcare. For monetary policy purposes, PCE is the standard because it is more methodologically sound and less subject to substitution bias. For understanding cost-of-living pressure on individual households, CPI is often more intuitive.
Why does the Fed use PCE instead of CPI?
The Fed officially adopted PCE as its inflation target in 2012 for three main reasons: broader coverage of consumer spending including government and employer-paid healthcare, a chain-weighting formula that adjusts monthly for consumer substitution behavior, and historically smaller after-the-fact revisions. The Fed also prefers core PCE specifically because stripping out food and energy reduces volatility and provides a better signal of persistent demand-side inflation that monetary policy can address.
Is PCE higher or lower than CPI?
Over the long run, PCE consistently runs lower than CPI by roughly 0.3 to 0.5 percentage points per year. The main drivers are CPI's heavier shelter weight (about 34% versus 16% in PCE) and CPI's slower substitution adjustment. There are specific months where PCE can exceed CPI, particularly when healthcare or financial services costs spike, but the structural tendency is for CPI to run hotter.
What is the Fed's inflation target for 2026?
The Federal Reserve's target remains 2% for the PCE price index on a longer-run basis, as stated in its Statement on Longer-Run Goals and Monetary Policy Strategy. In April 2026, core PCE stood at 3.3% year-over-year, 130 basis points above that target. The Fed has signaled it wants to see sustained progress toward 2% before easing policy further.
What is core PCE inflation?
Core PCE is the Personal Consumption Expenditures price index with food and energy prices removed. The Fed focuses on core PCE rather than headline PCE because food and energy prices are volatile and largely driven by supply factors outside the Fed's control. Core PCE provides a cleaner signal of the underlying demand-side inflation trend. As of April 2026, core PCE was running at 3.3% year-over-year according to the BEA.
How often are CPI and PCE released?
CPI is released monthly by the Bureau of Labor Statistics, typically in the second week of the following month. PCE is released monthly by the Bureau of Economic Analysis as part of the Personal Income and Outlays report, typically about two weeks after CPI, in the fourth week of the following month. For example, the April 2026 CPI was released May 12, and the April 2026 PCE was released May 28.
Why does CPI weight shelter more heavily than PCE?
CPI is based on household expenditure surveys that ask consumers directly what they spend money on. Because shelter is the largest single item in most household budgets, it receives a correspondingly large weight in CPI at around 34%. PCE derives its weights from business-side spending data and national accounts, which cover the full economy including large categories like healthcare and financial services. In that broader context, shelter is a smaller share of total spending, landing around 16% in PCE.
Can prediction markets predict the next CPI or PCE reading?
Prediction markets on platforms like Polymarket and Kalshi aggregate the expectations of many traders into a single probability distribution over possible inflation outcomes. Research on prediction markets generally finds they are at least as accurate as expert consensus forecasts and often better at incorporating recent data quickly. They are not guaranteed to be right, but the crowd-sourced odds represent real money on the line, which aligns incentives in ways that survey-based forecasts do not. MacroOdds tracks these live odds for every major CPI and PCE release.