What Is an Inverted Yield Curve? Recession Signal
What Is an Inverted Yield Curve?
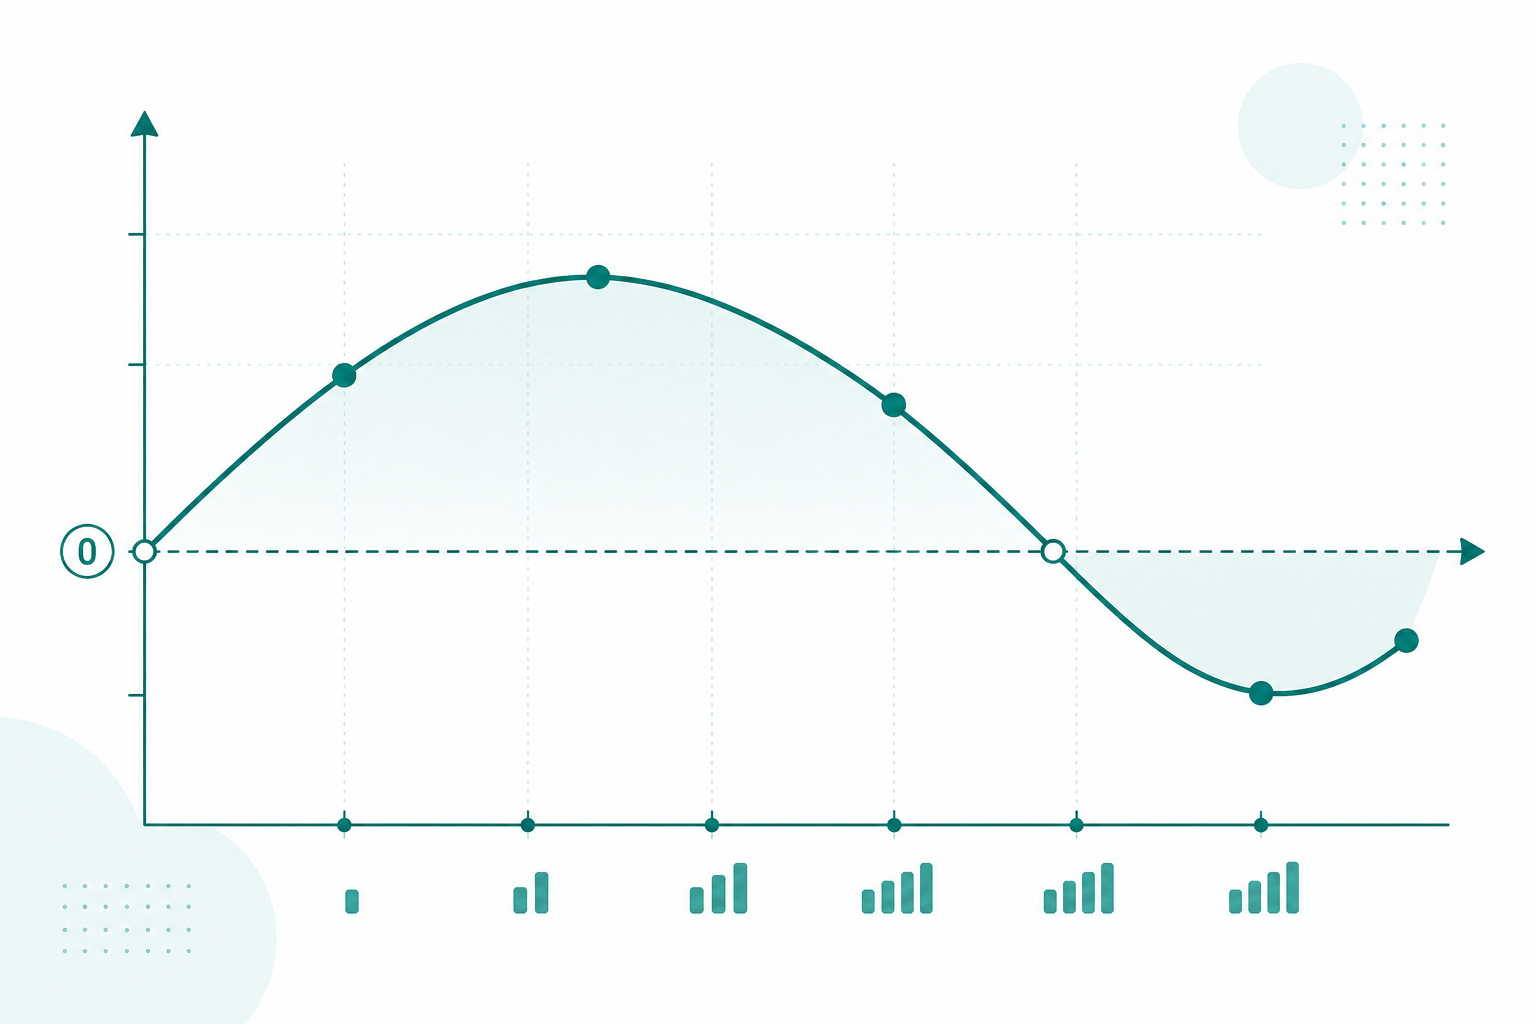
The inverted yield curve is arguably the most-watched recession indicator in all of finance. It sounds technical, but the core idea is simple: under normal conditions, you earn a higher interest rate for lending money over a longer period. An inverted yield curve flips that logic on its head. Short-term government bonds pay more than long-term ones, a signal so consistent that it has preceded every U.S. recession since 1955.
When investors pile into long-dated Treasuries and accept lower yields on 10-year bonds than on 2-year notes, they are betting that the future will be weaker than the present. They are locking in today's rates because they expect the Federal Reserve to cut rates sharply in coming years, which is exactly what central banks do when economies slow or contract.
We track the 10y-2y spread and the live recession odds on MacroOdds because no single data point concentrates as much market intelligence into one number. The spread is a real-time pulse on what the bond market, collectively worth tens of trillions of dollars, believes about the economic path ahead.
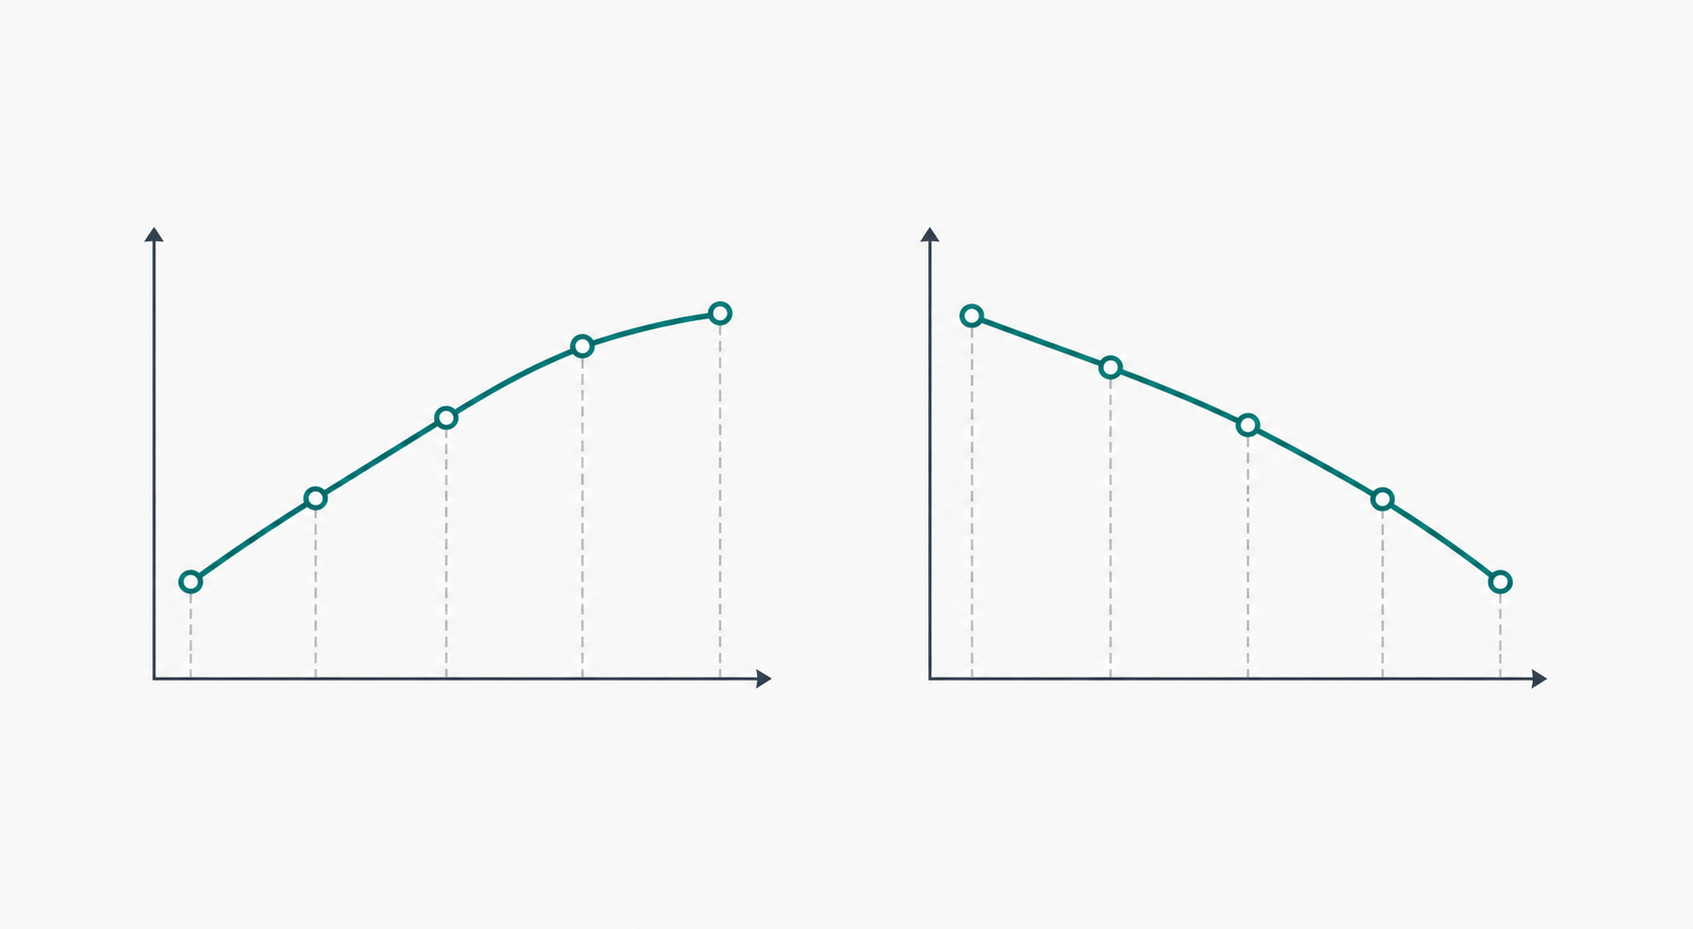
Normal, Flat, and Inverted: What the Curve Shape Tells You
The yield curve is not one number. It is a snapshot of interest rates at every maturity from 1 month to 30 years. Its shape shifts constantly with investor sentiment, Fed policy, and inflation expectations. Three shapes matter most.
| Shape | What It Looks Like | What It Signals |
|---|---|---|
| Normal (Upward-Sloping) | 10-year yield higher than 2-year yield (e.g., +100 to +200 bps) | Economy is expanding; investors demand a premium for tying up capital long-term; Fed policy is accommodative or neutral. |
| Flat | 10-year and 2-year yields nearly equal (roughly -20 to +20 bps) | Economic transition; uncertainty about growth; often a precursor to inversion if short rates keep rising. |
| Inverted (Downward-Sloping) | 2-year yield higher than 10-year yield (e.g., negative spread) | Bond market pricing in future rate cuts; high historical correlation with recession in the next 6-22 months. |
The three primary yield curve shapes and their economic interpretations.
The flat curve is underappreciated. It is the transition zone where many investors stop watching, often right before the inversion that triggers alarm. We saw this exactly in late 2021 and early 2022 as the Fed began its most aggressive tightening cycle in 40 years.
Yield Curve Inversion and Recession: The Historical Record
The yield curve inversion recession relationship is one of the most reliably documented patterns in modern economics. With one arguable exception, the 10y-2y spread has inverted before every U.S. recession since the mid-1950s. The question is never whether the signal is real. The question is always about timing.
| Inversion Start | Peak Inversion (bps) | Recession Start | Lag (Months) |
|---|---|---|---|
| Aug 1978 | -230 | Jan 1980 | 17 |
| Sep 1980 | -250 | Jul 1981 | 10 |
| Jan 1989 | -60 | Jul 1990 | 18 |
| Feb 2000 | -50 | Mar 2001 | 13 |
| Jan 2006 | -19 | Dec 2007 | 23 |
| Aug 2019 | -50 | Feb 2020 | 6 |
| Jul 2022 | -108 (peak Jul 2023) | TBD | TBD |
Historical 10y-2y inversions and the recessions that followed. Sources: FRED, NBER.
The average lag across these cycles is roughly 12-18 months, but the range runs from 6 months (the brief 2019-2020 episode, abbreviated by the pandemic shock) all the way to 23 months for the 2006 inversion that preceded the Global Financial Crisis. That spread tells you something important: the yield curve gives you a window, not a date.
The one near-miss was 1966-1967, when the curve briefly inverted and growth slowed sharply but the NBER did not formally declare a recession. Depending on your definition, even that exception reinforces the rule: an inversion at minimum signals significant economic stress.
The 2022-2024 Inversion: The Longest in 45 Years
The inversion that began on July 5, 2022 became the longest in modern history. The 10-year yield fell below the 2-year yield and stayed there for over two years, peaking at a negative 108 basis points in July 2023. To put that in context: you were earning more than a full percentage point more annually on a 2-year Treasury than on a 10-year Treasury.
The bond market was pricing in something specific: that the Fed's rapid rate hikes would ultimately break growth, forcing the Fed to reverse course and slash rates over the subsequent years. And the Fed did begin cutting, starting in September 2024. The inversion finally ended in October 2024 as short rates fell with Fed policy while long rates held firm, reflecting sticky inflation expectations.
What made this cycle different, or at least felt different, was the lack of an immediate recession. GDP grew 2.9% in 2023 and above 3% annualized in the second and third quarters of 2024. The economy proved remarkably resilient, supported by pandemic-era savings, a tight labor market, and massive fiscal stimulus. The yield curve's warning had not been wrong. It had been early.
Does an Inverted Yield Curve Mean Recession Is Certain?
The honest answer to whether an inverted yield curve means recession is: it raises the probability dramatically, but it does not guarantee one. The New York Fed's probit model, which uses the 10y-3m spread, translates the curve into a formal probability estimate updated monthly. As of June 2026, that model places recession probability over the next 12 months at approximately 21%.
There are legitimate reasons an inversion might not produce a recession. Central banks can cut rates preemptively enough to engineer a soft landing. Fiscal stimulus can offset monetary tightening. Productivity shocks can boost growth even as financing conditions tighten. None of these disqualify the signal; they are exactly the factors that could explain a longer-than-average lag.
We track real-time recession odds on MacroOdds precisely because the curve alone is not enough. Prediction markets aggregate information from thousands of participants who are also watching employment, manufacturing, credit spreads, and earnings. The combination of curve signals and market-implied odds gives you a richer picture than either alone.
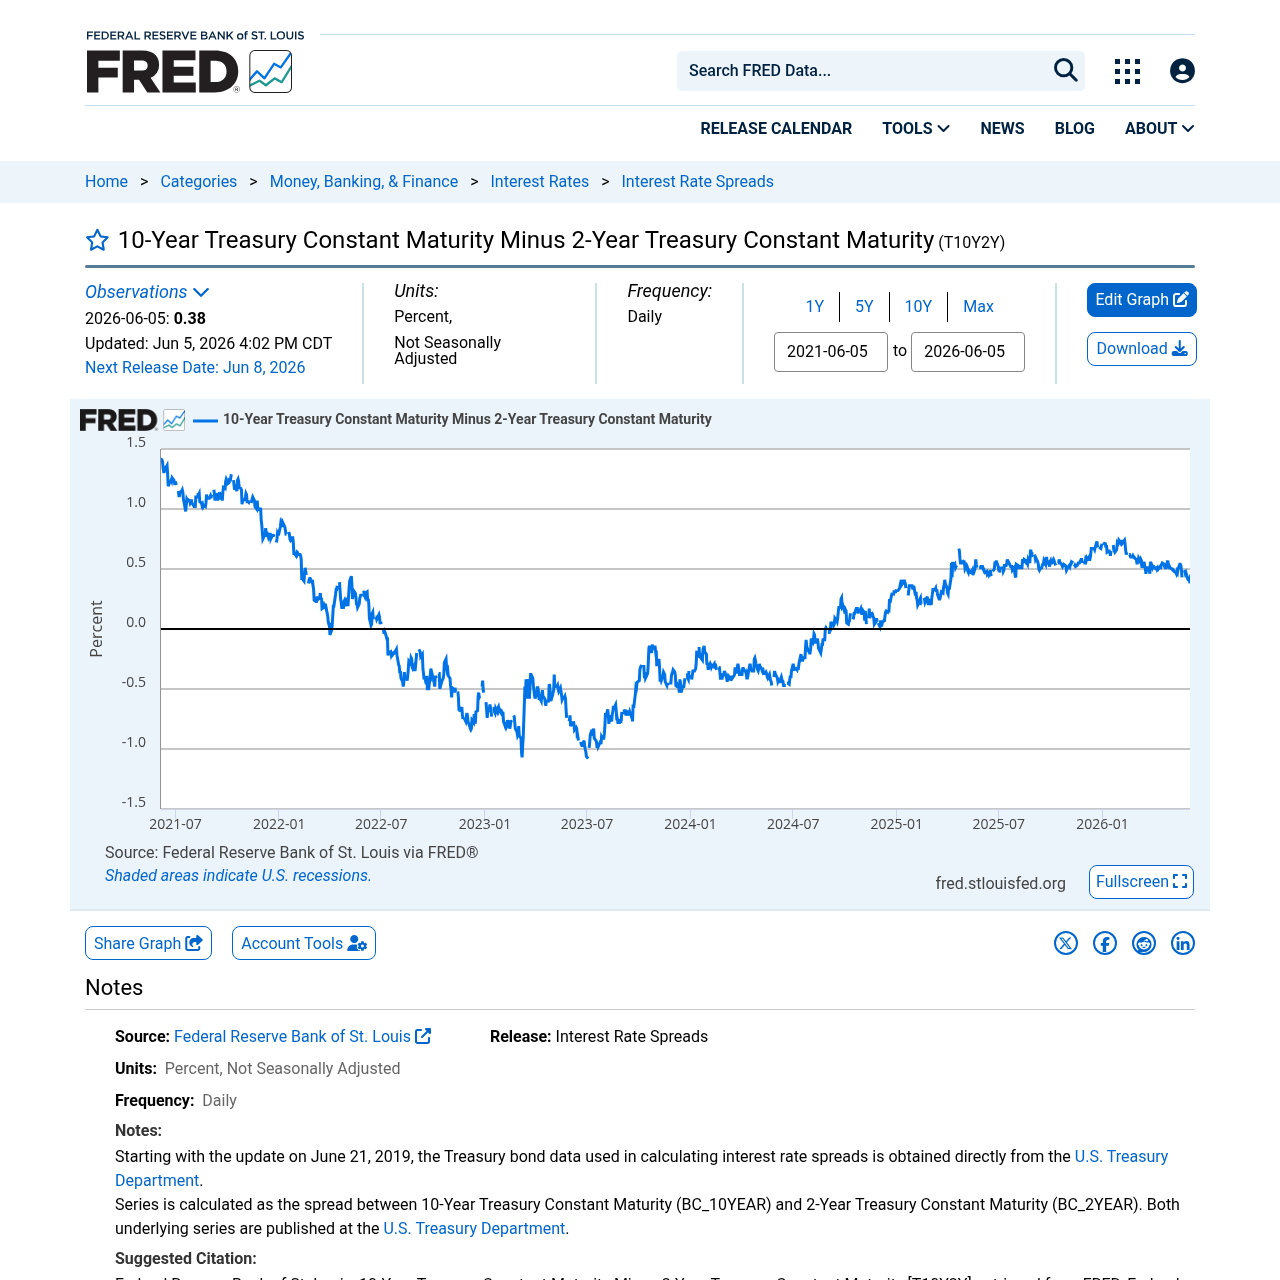
The 10-Year 2-Year Spread: How to Read It in Practice
The 10 year 2 year spread is calculated exactly as it sounds: you take the yield on the 10-year Treasury note and subtract the yield on the 2-year Treasury note. When the result is positive, the curve is normal. When it goes negative, the curve is inverted. FRED publishes this daily as series T10Y2Y, updated each market day by 5 PM Eastern. MacroOdds pulls this data and displays it live alongside our fed rate cut probability tracker.
As of June 5, 2026, the 10y-2y spread sat at +0.38% (38 basis points), with the 10-year at roughly 4.55% and the 2-year at about 4.17%. The curve has re-steepened meaningfully from its deeply inverted levels.
Here is why the re-steepening matters as much as the initial inversion. In most historical cycles, the spread re-steepens sharply right as the recession begins. Short rates fall as the Fed cuts, while long rates stay elevated (or even rise on growth concerns). This positive spread is not an all-clear. It is, counterintuitively, often the phase when recession risk peaks and coincides with early labor market deterioration.
Yield Curve Un-Inversion: The Phase Most Investors Miss
The yield curve un-inversion gets far less attention than the original inversion, but the historical record suggests it deserves equal scrutiny. When the curve flips back from negative to positive, it often means one of two things: either the Fed has cut short rates enough to normalize conditions (a soft landing), or the long end is rising on growth and inflation fears while the front end is falling on recession fears. The latter scenario is typically the dangerous one.
Look at the 2006-2007 cycle. The 10y-2y spread inverted in January 2006, reached a modest negative 19 basis points at its deepest, then began re-steepening through 2007. The Great Recession officially started in December 2007, right as the curve was normalizing. Many investors who had been watching for the inversion had already stopped worrying by the time the recession hit.
The same pattern appeared before the 2001 recession and the 1990-1991 recession. The un-inversion is not the signal to stand down. It is often the last warning before the storm. We saw the 2022-2024 inversion end in October 2024. The question of whether a recession follows in 2025-2026 remains live, which is why watching recession odds in 2026 has real analytical value.
The New York Fed Model and the 10y-3m Spread
While most financial media focuses on the 10y-2y spread, the New York Fed uses the difference between the 10-year Treasury yield and the 3-month Treasury bill in its formal recession probability model. This is not arbitrary. The 3-month yield is more directly controlled by the Fed's policy rate, making the 10y-3m spread a cleaner measure of how restrictive policy actually is relative to long-run expectations.
The model was developed by economists Arturo Estrella and Frederic Mishkin. It uses a probit regression to translate the spread into a 12-month recession probability. The methodology has been publicly available since 1996, and the New York Fed updates estimates monthly at newyorkfed.org. The current estimate of roughly 21% recession probability is elevated versus a typical expansion phase reading below 10%, but well below the 40-50%+ readings that accompanied deep inversions before major recessions.
What the Yield Curve Means for Mortgages and Your Portfolio
The yield curve does not just signal recession risk in the abstract. It has direct, practical implications for borrowing costs throughout the economy. Mortgage rates are closely tied to the 10-year Treasury yield. When the curve was deeply inverted, the 10-year yield was often suppressed even as the Fed funds rate was high, which created unusual pricing dynamics for long-term loans.
During the 2022-2024 inversion, the 10-year held in a range of roughly 3.5% to 5%, while the 2-year ran as high as 5.25%. Mortgage rates tracked the 10-year but with a historically wide spread over it, reflecting elevated uncertainty. As the curve re-steepens and the 10-year rises, mortgage rates can follow. We cover this dynamic in detail in our mortgage rates outlook for 2026.
For equity investors, the yield curve inversion has a nuanced relationship with stock returns. Equities often continue rising for 12-18 months after an initial inversion before rolling over. The market correctly reads strong near-term earnings while discounting future risk. The trouble comes later, when the lagged effects of tight monetary policy hit corporate profits and the labor market begins softening.
Frequently asked questions
What is an inverted yield curve in simple terms?
An inverted yield curve means short-term U.S. Treasury bonds pay higher interest rates than long-term Treasury bonds. Normally you earn more for lending money over a longer period. When the curve inverts, investors are so worried about future growth that they drive up demand for long-term bonds, pushing long-term yields below short-term ones. It is the bond market collectively betting that economic conditions will be weaker in the future than they are today.
What does the 10-year 2-year spread tell you?
The 10y-2y spread is the yield on the 10-year Treasury note minus the yield on the 2-year Treasury note. When positive, the curve is normal. When negative, it is inverted. FRED tracks this daily as series T10Y2Y. As of June 2026, the spread is slightly positive at around +38 basis points, having recovered from the record -108 basis point inversion in July 2023.
Does an inverted yield curve always mean a recession is coming?
Not with certainty, but the historical track record is impressive. The 10y-2y spread has inverted before 7 of 8 U.S. recessions since 1955. The signal raises recession probability significantly, but it does not guarantee a recession or nail down the timing. The lag between inversion and recession has ranged from 6 months to over 22 months in historical cycles. Treat it as a serious warning signal, not a guaranteed prediction.
How long did the 2022-2024 yield curve inversion last?
The 10y-2y spread first inverted on July 5, 2022, and the inversion ended in October 2024, a span of more than 28 months. That makes it the longest continuous inversion since at least the late 1970s. At its deepest, the spread reached -108 basis points in July 2023. Despite this historically extreme inversion, no NBER-declared recession occurred during the inversion period itself.
What is the New York Fed yield curve recession model?
The New York Fed uses a probit regression model developed by economists Arturo Estrella and Frederic Mishkin to estimate the probability of a U.S. recession 12 months ahead. Unlike most media coverage that focuses on the 10y-2y spread, the NY Fed model uses the 10-year minus 3-month Treasury spread. The model updates monthly and is publicly available at newyorkfed.org. As of mid-2026, the model places recession probability at roughly 21%.
What is yield curve un-inversion and should investors worry about it?
Yield curve un-inversion is when the spread returns from negative to positive after a period of inversion. Counterintuitively, this is not always an all-clear signal. In multiple historical cycles, the actual recession began right around the time the curve was normalizing. The 2007-2009 Great Recession and the 1990-1991 recession both started as the curve was re-steepening. The un-inversion often reflects the Fed cutting rates in response to deteriorating conditions, which itself signals economic stress.
What is the difference between the 10y-2y and 10y-3m yield curve spread?
Both measure the gap between long-term and short-term Treasury yields, but they use different reference points. The 10y-2y uses the 2-year note, which reflects market expectations for Fed policy over roughly two years. The 10y-3m uses the 3-month bill, which closely tracks the current Fed funds rate. The New York Fed prefers the 10y-3m for its recession model because it captures actual policy restrictiveness more directly.
How does the yield curve affect mortgage rates?
Mortgage rates are primarily benchmarked to the 10-year Treasury yield, not the Fed funds rate. When the yield curve is inverted, the 10-year yield is often lower than you would expect given overall interest rate levels, which can partially cap mortgage rates. When the curve re-steepens and the 10-year rises, mortgage rates tend to follow. Lenders also add a variable spread over Treasuries that reflects credit risk and prepayment uncertainty, so the relationship is not one-to-one.