US National Debt Explained (2026): How Big Is It?

The US national debt is the single largest number in American public life, and most people have no idea what it actually means for their wallet. As of early June 2026 the total stands at roughly $39.2 trillion. That is not a rounding error or a Washington talking point. It is the accumulated tab that every year of deficit spending since the founding has run up, and right now the interest bill alone is closing in on $1 trillion a year.
We are going to treat this number seriously. Not to catastrophize, and not to wave it away as something governments can always refinance forever. The truth sits between those two poles, and understanding it matters for anyone trying to read interest rates, assess recession risk, or figure out whether the Fed will cut rates this year.
Here is what the debt actually is, who holds it, what it costs, and why it is one of the most important variables shaping the live U.S. economy snapshot right now.
How Big Is the National Debt Right Now?
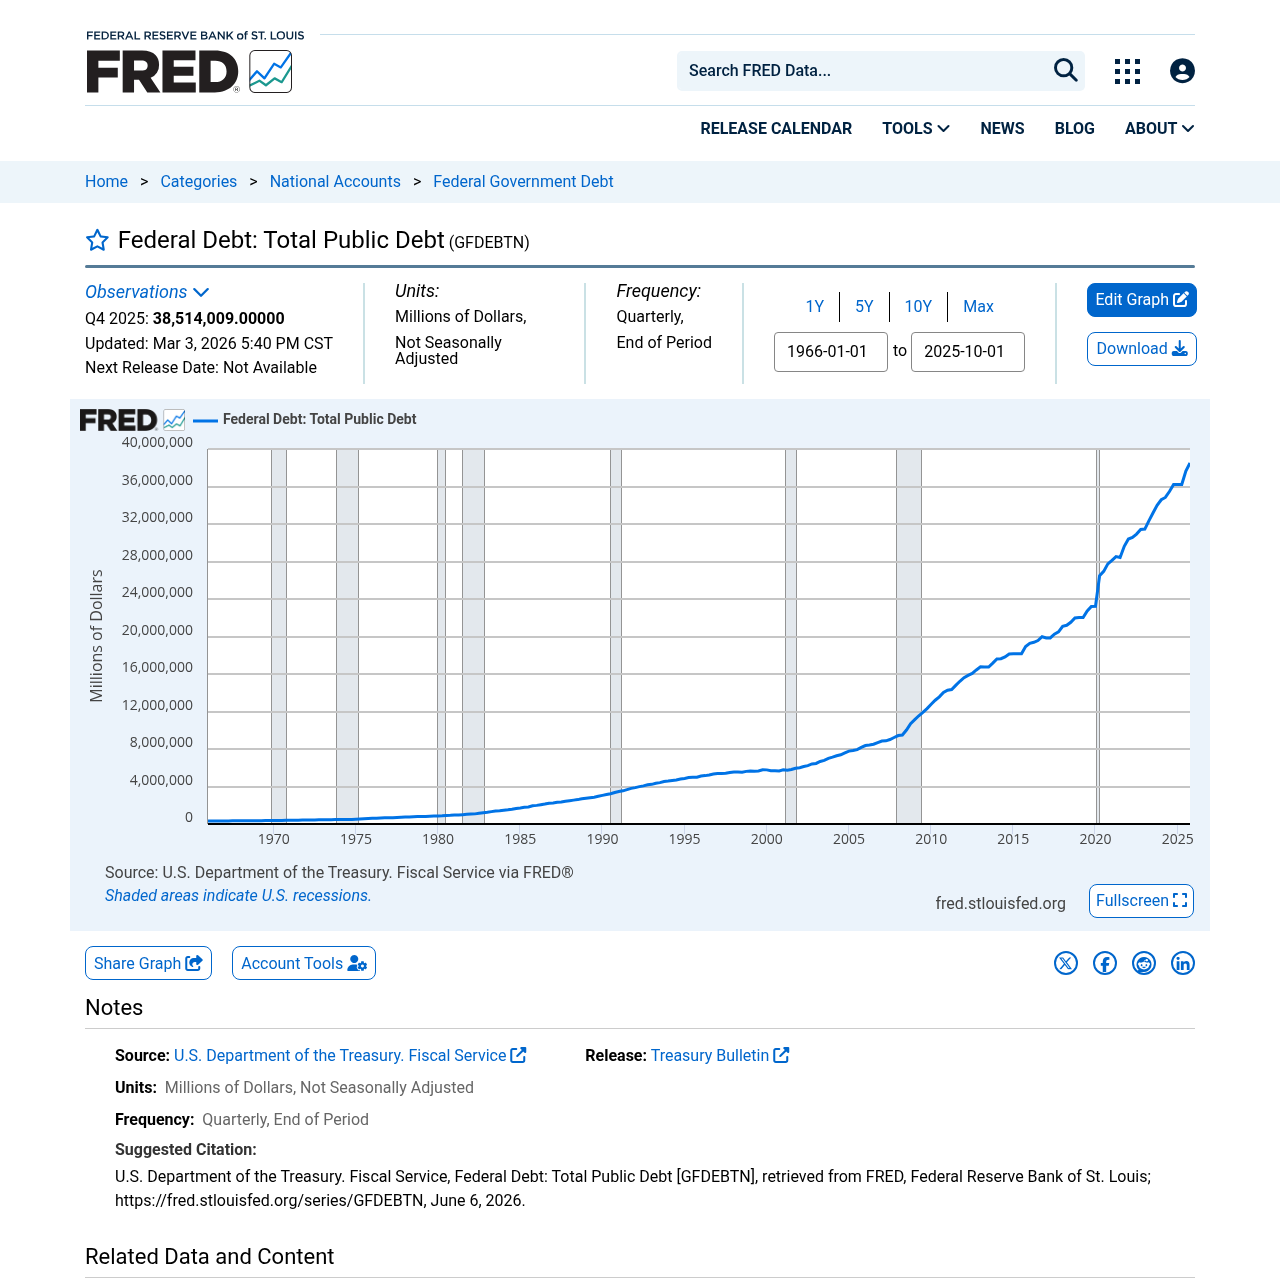
Gross federal debt crossed $39 trillion in early 2026 and has not looked back. According to U.S. Treasury Fiscal Data, the total outstanding debt as of June 4, 2026 was approximately $39.23 trillion. At the end of 2025 the figure was $37.64 trillion, which means the debt grew by roughly $1.6 trillion in the first five months of 2026 alone. The Joint Economic Committee calculates the daily run rate at more than $8 billion.
That growth is not a mystery. The federal government is running a fiscal year 2026 deficit of approximately $1.9 trillion -- about 5.8% of GDP. Every dollar of deficit that cannot be covered by tax revenue gets borrowed. Treasury auctions off bills, notes, and bonds to cover the gap, and the accumulated stock of that borrowing is the national debt.
The two categories worth keeping straight are debt held by the public (Treasuries owned by investors, foreign governments, the Federal Reserve, and market participants) and intragovernmental holdings (money the government owes to trust funds like Social Security). The public debt number is what drives market interest rates. The total gross figure, which includes intragovernmental debt, is what the debt ceiling tracks.
The National Debt Clock: What the Live Number Actually Tracks
The national debt clock -- whether you are watching the Times Square billboard or a real-time web counter -- typically displays the gross federal debt, the all-in total including intragovernmental holdings. It ticks upward almost without pause because the government runs a deficit in most years and interest compounds daily.
The clock is useful for visceral impact but slightly misleading for economic analysis. Economists and the CBO generally focus on debt held by the public because that is the portion that competes with private borrowing for available capital. When the Treasury issues a new 10-year note to cover the deficit, it is effectively bidding for money in the same pool that businesses and homebuyers use. That competition is the channel through which deficits influence interest rates.
Tracking the pace of change matters more than any single snapshot. At the current daily run rate, the U.S. is expected to cross $40 trillion by approximately September 2026. For context: it took the country until 2008 to reach $10 trillion, and only nine years to add the next $20 trillion. The compounding effect of deficit-on-deficit is accelerating.
US Debt Interest Payments: The $1 Trillion Line
This is the number that should concern anyone who follows the federal budget. The CBO projects net interest payments will exceed $1 trillion in fiscal year 2026, a figure that represents 14% of all federal spending or 19 cents of every dollar the government collects in taxes and fees. Only Social Security and Medicare are larger line items.
Fortune reported in May 2026 that the Treasury was paying roughly $3 billion per day just to service the debt. A separate April 2026 report put monthly interest spending at $88 billion, equal to what the federal government spends on defense and education combined. These are not theoretical projections. They are current, cash payments leaving the Treasury every single day.
The reason the number exploded so suddenly is the interaction of a much larger debt stock with interest rates that rose sharply from 2022 through 2024. During the near-zero rate era, even a large debt carried modest service costs because the average rate across all outstanding Treasuries was very low. As those low-rate bonds mature and get refinanced at 4-5% yields, the weighted average interest rate on the entire debt stack climbs. We are still in the middle of that repricing cycle.
Looking forward, the CBO projects interest payments will more than double from $1 trillion in 2026 to $2.1 trillion by 2036 -- growing faster than any other major budget category, including Social Security. Over the 2026-2036 window, net interest is projected to grow 106%. That crowding-out dynamic -- where interest displaces spending on defense, education, infrastructure, and research -- is the central fiscal policy problem of the coming decade.
| Metric | FY 2025 | FY 2026 (Projected) | FY 2036 (Projected) |
|---|---|---|---|
| Net interest payments | ~$970 billion | ~$1.0 trillion | ~$2.1 trillion |
| Interest as % of GDP | ~3.2% | ~3.3% | ~5.3% |
| Interest as % of revenue | ~17% | ~19% | ~27% |
| Daily interest cost (approx.) | ~$2.7 billion | ~$3 billion | ~$5.8 billion |
Federal interest cost trajectory. Sources: CBO Budget and Economic Outlook (February 2026), U.S. Treasury Fiscal Data.
Debt to GDP: What the Ratio Actually Tells Us
Raw dollar figures are hard to contextualize across decades and across countries. Debt-to-GDP is the standard way economists compare fiscal positions. It measures how large the debt stock is relative to the economy's annual output -- essentially, how many years of GDP it would take to pay down the debt if every dollar went to that purpose.
The CBO's February 2026 outlook projects that federal debt held by the public will reach 101% of GDP by the end of fiscal year 2026, up from 99% at the end of FY 2025. The U.S. last crossed 100% debt-to-GDP back in 2013 and has not looked back since. The CBO projects continued deterioration to 108% by 2030 and 120% by 2036 -- which would surpass the post-World War II peak of 106% recorded in 1946.
What does 101% actually mean? It means the debt stock is now slightly larger than the entire annual output of the U.S. economy. Japan has operated above 200% for years without a sovereign crisis, but Japan has a very high domestic savings rate and borrows almost entirely from its own citizens. The U.S. situation is different: roughly 31% of publicly held debt is owned by foreign creditors, which makes the country more sensitive to changes in external demand for Treasuries.
The fiscal year 2026 deficit is running at 5.8% of GDP. That is not a wartime or crisis-era number. It is a peacetime structural deficit, which is unusual in the historical context and explains why the ratio keeps climbing even when the economy is growing.
Who Owns the National Debt?
One of the most common misconceptions about US debt is that it is primarily owned by China. That was closer to true in the early 2010s. Today the ownership picture is much more diversified, and domestic holders far outweigh any single foreign creditor.
The largest single holder is the U.S. government itself, through intragovernmental accounts like the Social Security Trust Fund. Among public holders, the Federal Reserve has owned a significant share through its quantitative easing programs, though its balance sheet has been shrinking since 2022 through quantitative tightening. American households, pension funds, mutual funds, insurance companies, and banks hold the bulk of the remaining domestically-owned public debt.
Foreign holdings total approximately $9.3 trillion as of early 2026, representing about 31% of publicly held debt. Japan is the largest foreign creditor at $1.24 trillion, followed by the United Kingdom at $897 billion. China, once the top foreign holder, has been gradually reducing its exposure: its holdings fell from roughly $784 billion in early 2025 to $693 billion by February 2026 as Beijing diversified away from dollar assets.
| Holder Category | Approximate Holdings | Share of Public Debt |
|---|---|---|
| Federal Reserve (QT ongoing) | ~$4.4 trillion | ~15% |
| U.S. households, funds, insurers | ~$10+ trillion | ~35% |
| U.S. state and local governments | ~$1.2 trillion | ~4% |
| Foreign governments and investors (total) | ~$9.3 trillion | ~31% |
| Japan (largest foreign holder) | ~$1.24 trillion | ~4.3% |
| United Kingdom | ~$0.90 trillion | ~3.1% |
| China | ~$0.69 trillion | ~2.4% |
| All other foreign holders | ~$6.5 trillion | ~22% |
Who holds US public debt, approximate figures as of early 2026. Sources: U.S. Treasury, Federal Reserve, Congress.gov CRS.
The foreign holder composition matters for two reasons. First, if a large creditor like Japan needs to sell Treasuries (as it might if it needs to support the yen), U.S. yields rise regardless of what the Fed does. Second, the gradual reduction in Chinese holdings is part of a broader geopolitical diversification that, at the margin, reduces demand for Treasuries and keeps the term premium elevated.
Why the National Debt Pushes Interest Rates Higher
The connection between the national debt and the rates you pay on a mortgage or car loan is real, but it runs through several steps. Understanding the mechanism helps you separate genuine fiscal risk from political noise.
Step one: every time the federal government runs a deficit, it issues new Treasuries. The Treasury is effectively a borrower in the bond market, competing for the same pool of savings as corporations and households. More Treasury issuance, all else equal, means lower bond prices and higher yields.
Step two: the 10-year Treasury yield is the benchmark for most long-term borrowing in the U.S. economy. Mortgage rates are calculated as a spread over the 10-year yield. Investment-grade corporate bonds are priced as a spread over Treasuries. When the 10-year yield is held higher by relentless Treasury supply, the cost of private credit rises with it.
Step three: fiscal concerns also affect what investors demand as compensation for the risk of holding 30-year Treasuries. This is the term premium -- the extra yield investors require beyond what they expect short rates to average over the bond's life. When creditors worry about long-run fiscal sustainability, the term premium rises, pushing up long-end yields even if the Fed cuts short-term rates. That is exactly the dynamic that kept the 10-year yield near 4.5-4.7% through much of 2025-2026 even as the Fed was cutting.
For homebuyers this is brutally concrete. The 30-year fixed mortgage rate stood near 6.5% in late May 2026, per Bankrate data. A structural fiscal premium of even 50-100 basis points in the 10-year yield translates to hundreds of dollars per month on a median mortgage. See our deeper look at whether mortgage rates will drop in 2026 for how this plays out in the housing market specifically.
Can the US Ever Stabilize the Debt?
Probably not through outright repayment, and that is not necessarily the goal. The realistic objective is debt stabilization: keeping the debt-to-GDP ratio from rising indefinitely, not eliminating the nominal stock. A growing economy can carry a growing nominal debt as long as growth and the primary fiscal balance keep the ratio from spiraling.
The math is harder today than it was a decade ago. Stabilizing the debt-to-GDP ratio requires a primary surplus -- tax revenue exceeding non-interest spending -- large enough to offset the gap between the interest rate on the debt and the GDP growth rate. With the current average interest rate on the debt rising toward 3-4% and nominal GDP growth running at roughly 4-5%, the required primary adjustment is substantial but not impossible.
The CBO's baseline shows no such adjustment in the forecast horizon. The structural deficit is projected to persist and widen, driven mainly by mandatory spending growth in Social Security and Medicare as the population ages. Without policy change -- either revenue increases or spending restraint -- the debt-to-GDP ratio will keep climbing. The Committee for a Responsible Federal Budget projects debt could reach 175% of GDP under the CBO's long-term scenario. That is not a crisis forecast for tomorrow. It is a trajectory that warrants attention today.
Prediction markets are beginning to price fiscal-tail-risk scenarios through instruments tied to recession odds and Fed policy. If fiscal credibility erodes sharply, the bond market will price it before Congress acts. That is the dynamic worth watching.
What the National Debt Means for Ordinary Americans
The debt affects everyday financial life through three main channels: interest rates, inflation risk, and future taxes. The interest rate channel is the most immediate and already active.
Because the Treasury is the world's biggest bond issuer and the 10-year yield is structurally elevated by that supply, borrowing costs across the economy are higher than they would otherwise be. That shows up in mortgage rates around 6.5%, in credit card rates that remain stubbornly above 20%, and in the higher cost of capital for the businesses that employ people and invest in new capacity.
The inflation channel is more indirect but real. If markets ever concluded that the U.S. would attempt to inflate away the debt -- by keeping real rates negative over a long period -- inflation expectations would rise, which would itself push nominal yields higher. The Fed's credibility as an inflation fighter is partly a fiscal variable: it is harder to maintain that credibility when fiscal policy is persistently adding to demand. This is one reason the Fed has been cautious about cutting rates too aggressively even as inflation has come down toward 3-3.5%.
The future tax channel is simple arithmetic. Interest consuming 19 cents of every tax dollar collected leaves 81 cents for everything else. If that ratio rises to 27 cents by 2036 as the CBO projects, something has to give: taxes rise, other spending falls, or both. That fiscal squeeze is a reason to watch the long-run picture even if a near-term crisis seems distant.
The Bottom Line on the US National Debt
The US national debt at $39 trillion is not a sign of imminent collapse, but it is no longer easy to dismiss either. At 101% of GDP, with a structural deficit running at 5.8% of GDP and interest costs crossing $1 trillion for the first time in history, the fiscal position is meaningfully worse than it was a decade ago. The trajectory matters as much as the current level.
For investors and households, the most practical takeaway is the rate channel. Treasury supply is one of the structural forces keeping the 10-year yield elevated, and that yield feeds directly into mortgage rates, business lending, and the discount rates markets use to value everything from stocks to real estate. Understanding that the debt is partly why borrowing is expensive in 2026 is more useful than treating it as a distant abstraction.
For the fiscal picture broadly, the key number to watch is the primary balance -- whether the government's non-interest revenues and spending are converging or diverging. If the deficit excluding interest payments narrows, the debt-to-GDP ratio can stabilize even with a large nominal debt. If it keeps widening, the debt becomes self-reinforcing: more debt, more interest, more deficit, more debt. The CBO projects the latter path without policy change. Markets are not panicking about it today. But the 10-year yield does not need a crisis to reflect the premium for that uncertainty. It already does.
Frequently asked questions
What is the US national debt right now in 2026?
The total US national debt crossed $39.2 trillion in early June 2026, according to U.S. Treasury Fiscal Data. It is growing at more than $8 billion per day and is on track to exceed $40 trillion by approximately September 2026. The figure includes both debt held by the public (Treasuries owned by investors and foreign governments) and intragovernmental holdings such as the Social Security Trust Fund.
What is the national debt per person in the US?
With a population of approximately 335 million and a gross debt of $39.2 trillion, the per-capita share of the national debt is roughly $117,000 per person. That figure is sometimes used for impact but is not economically precise, since the debt is not an individual obligation. The more meaningful metric is debt-to-GDP, which measures the debt relative to the economy's capacity to service it.
How much does the US pay in interest on the national debt?
The Congressional Budget Office projects net federal interest payments will exceed $1 trillion in fiscal year 2026, the first time interest has crossed that threshold. That works out to roughly $3 billion per day, or about $88 billion per month. Interest is now the third-largest line item in the federal budget, behind only Social Security and Medicare, and is projected to double to $2.1 trillion by 2036.
What is the US debt-to-GDP ratio in 2026?
Federal debt held by the public is projected to reach approximately 101% of GDP by the end of fiscal year 2026, up from 99% at the end of FY 2025. This surpasses the pre-pandemic peak and is approaching the post-World War II high of 106% reached in 1946. The CBO projects the ratio will continue rising to 120% by 2036 absent significant policy changes.
Who owns the US national debt? Does China own most of it?
No. China is no longer the largest foreign holder and represents a modest share of total debt. As of early 2026, the largest holders of publicly held US Treasuries are domestic: U.S. households, pension funds, mutual funds, insurance companies, and the Federal Reserve collectively hold the majority. Foreign holdings total about $9.3 trillion (roughly 31% of public debt). Japan is the largest foreign creditor at $1.24 trillion, followed by the UK at $897 billion and China at $693 billion.
Does the national debt affect mortgage rates?
Yes, through the 10-year Treasury yield. When the federal government runs large deficits it must issue large amounts of Treasury bonds, which competes with private borrowing for available capital and puts upward pressure on yields. Since mortgage rates are priced as a spread over the 10-year Treasury, elevated fiscal supply keeps mortgage rates higher than they would otherwise be. The 30-year fixed mortgage rate was approximately 6.5% in late May 2026, partly reflecting this structural Treasury supply premium.
Can the US government default on its debt?
A technical default is possible if Congress fails to raise the debt ceiling in time to pay obligations, but the U.S. has never defaulted on its debt in its modern history. An outright default on Treasury bonds denominated in US dollars is considered extremely unlikely because the government can issue dollars. The more realistic concern is not a sudden default but a gradual erosion of fiscal credibility that pushes yields higher and forces difficult spending or tax choices.
What is the difference between the national debt and the deficit?
The deficit is the annual shortfall between government spending and revenue in a single fiscal year. For FY 2026 the deficit is projected at approximately $1.9 trillion. The national debt is the accumulated total of all past deficits (minus occasional surpluses) plus compounded interest. Think of the deficit as the amount added to a credit card balance each year, and the debt as the total balance on the card.