2026 FOMC Meeting Schedule: Every Date & What Happens
If you trade around the Fed, manage a bond portfolio, or just want to understand why mortgage rates move in bursts, the 2026 FOMC meeting schedule is the most important calendar on your desk. Every rate decision, every shift in the dot plot, every press-conference surprise flows from these eight meetings. Miss a date and you miss the event that moves markets.
We built this guide as a living reference. Below you will find every 2026 meeting date sourced directly from the Federal Reserve, a plain-English explanation of what actually happens inside each session, the difference between a regular meeting and a dot-plot meeting, and what traders should watch in the days around each decision. We also tie each meeting to the live Fed rate-cut probability odds that MacroOdds tracks in real time.
Let us start with the calendar itself, then work through the mechanics.
All Eight 2026 FOMC Meeting Dates at a Glance
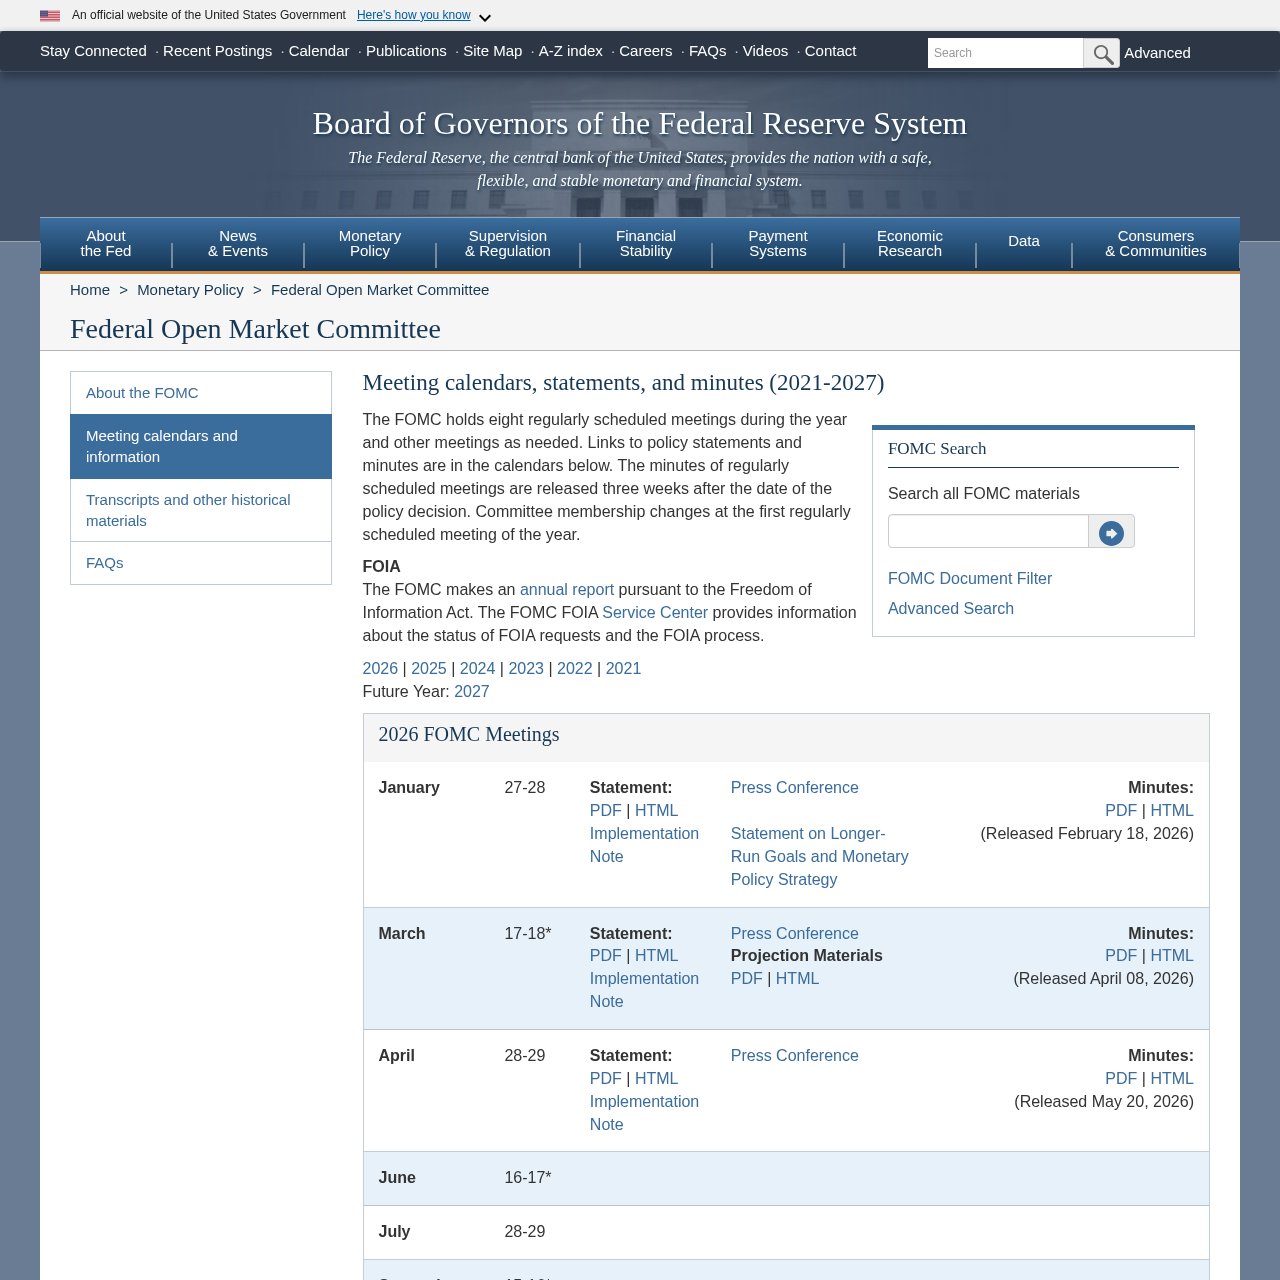
The Federal Reserve publishes this calendar at federalreserve.gov/monetarypolicy/fomccalendars.htm. The asterisk next to a meeting month signals a Summary of Economic Projections (SEP) release, also called the dot plot. All dates below are taken directly from that official source.
| Meeting | Dates | Decision Day | SEP / Dot Plot | Press Conference |
|---|---|---|---|---|
| 1 of 8 | January 27-28 | Wednesday, Jan 28 | No | Yes |
| 2 of 8 | March 17-18 | Wednesday, Mar 18 | Yes | Yes |
| 3 of 8 | April 28-29 | Wednesday, Apr 29 | No | Yes |
| 4 of 8 | June 16-17 | Wednesday, Jun 17 | Yes | Yes |
| 5 of 8 | July 28-29 | Wednesday, Jul 29 | No | Yes |
| 6 of 8 | September 15-16 | Wednesday, Sep 16 | Yes | Yes |
| 7 of 8 | October 27-28 | Wednesday, Oct 28 | No | Yes |
| 8 of 8 | December 8-9 | Wednesday, Dec 9 | Yes | Yes |
Official 2026 FOMC Meeting Schedule (source: federalreserve.gov)
What Happens at an FOMC Meeting: A Step-by-Step Look
Understanding what actually happens inside an FOMC meeting makes the calendar far more useful than a simple list of dates. The process is more structured than most traders realize, and knowing the sequence helps you anticipate where surprises can enter.
Day one is largely internal. Staff economists from the Board of Governors present the Beige Book economic summary, the latest staff forecast (the "Tealbook"), and briefings on financial markets, international conditions, and any special policy topics under discussion. FOMC members discuss economic conditions among themselves but no policy vote happens yet.
Day two is when everything that matters to markets occurs. The committee debates policy options in the morning, then votes on the federal funds rate target range. At 2:00 p.m. Eastern the Fed releases its policy statement and, at dot-plot meetings, the full SEP document. At 2:30 p.m. the chair holds a live press conference, taking questions from reporters for roughly 45 to 60 minutes. The chair's tone and specific word choices in that press conference routinely move equities, bonds, and the dollar more than the rate decision itself.
| Output | All 8 Meetings | SEP / Dot-Plot Meetings Only |
|---|---|---|
| Rate decision (hold, hike, or cut) | Yes | Yes |
| FOMC policy statement | Yes | Yes |
| Implementation note (reserve rates) | Yes | Yes |
| Chair press conference | Yes (since 2019) | Yes |
| Summary of Economic Projections (SEP) | No | Yes |
| Dot plot (rate-path projections) | No | Yes |
| GDP, unemployment, inflation forecasts | No | Yes |
| Meeting minutes (published ~3 weeks later) | Yes | Yes |
What Each Type of 2026 FOMC Meeting Can Produce
One important note on press conferences: since 2019, the Fed chair holds a press conference after every single meeting, not just the dot-plot meetings. Before 2019, the chair only appeared at quarterly SEP meetings. That change was significant because it meant the Fed could move rates at any of the eight sessions without being constrained by the absence of a press conference to explain the decision.
The Four Dot-Plot Meetings: Why They Hit Different
The FOMC dot plot is officially called the Summary of Economic Projections, but traders universally call it the dot plot because each policymaker's rate forecast appears as an anonymous dot on a chart. The document also includes committee forecasts for GDP growth, the unemployment rate, and the PCE inflation measure. It is as close as the Fed gets to publishing a rate roadmap, which is exactly why it moves markets.
The four 2026 dot-plot meetings are March 17-18, June 16-17, September 15-16, and December 8-9. At each of these, the Fed releases projections covering the current year and the next two to three years. When the median dot shifts from two cuts to one cut, or from one cut to no cuts, the bond market reprices immediately. We saw that dynamic play out sharply at the March 2026 meeting.
Watch the longer-run dot in particular. That is the committee's estimate of the neutral rate, the rate that is neither stimulative nor restrictive over the long run. When the longer-run dot creeps higher, as it has been doing gradually since 2024, it signals that the Fed thinks a structurally higher rate environment is here to stay. For anyone trying to model mortgage rates or corporate borrowing costs out beyond 2026, that number matters enormously.
2026 FOMC Meeting Dates: Month-by-Month Preview
Here is what to watch at each of the remaining 2026 sessions, based on the economic context as of early June 2026.
January 27-28 (Complete)
The January meeting produced a hold at 4.25-4.50%, consistent with the late-2025 pause. The committee also restated its Statement on Longer-Run Goals and Monetary Policy Strategy, an annual housekeeping exercise. Minutes from this meeting showed early debate about the pace of balance-sheet runoff.
March 17-18 (Complete, with SEP)
The March dot-plot meeting held rates steady and released updated projections. With core PCE still above 3%, the committee's median dot penciled in two cuts for all of 2026, down from three in December 2025 projections. The press conference signaled patience. Minutes reflected significant internal debate.
April 28-29 (Complete)
April was the most contentious meeting of the year so far. The FOMC voted 8-4 to hold, the highest number of dissents since 1992. Four members disagreed on the direction, not just the timing, which is a rare signal of genuine policy uncertainty. The statement added language noting "elevated uncertainty" around both inflation and employment, a phrase traders should bookmark.
June 16-17 (Next: SEP meeting)
June is the most closely watched remaining meeting of 2026. It is a dot-plot meeting, which means updated projections will either validate the March baseline of two cuts or revise it. If May CPI and PCE data (releasing before the meeting) show further inflation stickiness, expect the median dot to shift to one cut or zero for 2026. Check MacroOdds live odds for real-time prediction-market pricing on the June decision.
July 28-29
July is a non-SEP meeting with a press conference. Historically, July has been a month where the Fed acts if the preceding quarterly meeting planted the seed. If June's dot plot shifts dovish and summer data confirms cooling inflation, July is live. If June comes in hawkish, July is likely a hold while the committee waits for Q3 data.
September 15-16 (SEP meeting)
September is the second-most important meeting of the second half. A fresh round of projections will capture the full summer data dump, including two additional CPI prints, two PCE readings, and Q2 GDP revision. This is often the meeting where the Fed either endorses its earlier signal or walks it back. When will the Fed cut rates in 2026? September is the most credible candidate after June.
October 27-28
October is sandwiched between two SEP meetings, making it a positioning meeting. Unless there is a significant market dislocation or sharp economic deterioration, the Fed typically uses October to reinforce the message from September. The minutes, released three weeks later, often provide the clearest window into internal FOMC dynamics heading into year-end.
December 8-9 (SEP meeting)
The final meeting of the year ends with updated projections and a press conference. December tends to carry outsize psychological weight: the final dot plot of the year sets the narrative for the following year. A dovish December 2026 dot plot would stoke expectations for early 2027 cuts and reprice the front end of the curve immediately.
How to Track Fed Decisions in Real Time
The Fed does not telegraph decisions through leaks. It communicates through a carefully managed set of official channels, and knowing where to look puts you ahead of most retail participants.
Prediction markets have emerged as some of the fastest and most accurate real-time gauges of where rate odds stand. Platforms like Polymarket and Kalshi run continuous markets on specific FOMC outcomes, and those probabilities update the moment any relevant data hits. MacroOdds aggregates these signals on our Fed rate-cut probability page so you do not need to bounce between platforms. The CPI inflation prediction market we track is also directly relevant since inflation data is the single largest input into FOMC decisions.
Fed funds futures, traded on the CME Group, are the institutional market's pricing mechanism. The CME FedWatch tool derives implied probabilities from these contracts and publishes them for free. When the prediction-market odds diverge significantly from FedWatch, that gap is itself informative, either a mispricing or a signal that the markets are weighting different scenarios.
FOMC speaker calendar: in the weeks between meetings, FOMC members give speeches and testimony that are often more informative than the official statements. The Fed blackout period (no public communications on monetary policy) begins ten days before each meeting and lifts after the decision. Outside the blackout window, speeches by the chair and key regional presidents are primary market-moving events. We also track prediction-market odds for who will be the next Fed chair, which feeds longer-run monetary policy expectations.
What the Fed Can Actually Decide: Beyond the Rate Headline
Most coverage reduces FOMC meetings to a single binary: did they cut or not? That framing misses most of what moves markets. Here is the full menu of actions the committee can take.
- Change the federal funds rate target range (25 bp increments are standard; 50 bp moves signal urgency; 75 bp or more are emergency-level).
- Change the interest rate on reserve balances (IORB) to maintain control of the effective fed funds rate within the target range.
- Adjust the overnight reverse repurchase (ON RRP) rate to manage money-market conditions.
- Change the pace of balance-sheet runoff (QT) by adjusting the monthly caps on Treasury and mortgage-backed securities that roll off the balance sheet.
- Update forward guidance language in the statement, which can shift rate expectations for future meetings without moving rates today.
- Release a supplementary statement on longer-run goals (typically at the January meeting each year).
- Hold an unscheduled emergency meeting and take action between the eight scheduled sessions (rare but it has happened, most recently in 2020).
The inverted yield curve that has persisted through much of 2025 and early 2026 is partly a product of QT keeping longer-term supply elevated while shorter rates remain high. Any signal that the Fed is nearing the end of QT would be a significant independent market catalyst, separate from the rate-level decision.
Reading the Economic Data Calendar Alongside FOMC Dates
The FOMC does not make decisions in a vacuum. Every rate call is downstream of the data that arrives before the meeting. Knowing which data releases fall inside the blackout window versus outside it shapes how the market processes each print.
Before June 16-17: the Fed will have two May data points it did not have in April. May CPI (releasing around June 11) and May PPI (around June 12) land just inside or just at the edge of the blackout period, which makes them the freshest inputs. Because the blackout starts roughly ten days before a meeting, Fed speakers cannot comment on those prints, creating an information vacuum that prediction markets fill.
Before September 15-16: the Q2 GDP advance estimate releases in late July, followed by July and August CPI and PCE. This is the richest data stretch of the second half. If real economic growth slows while inflation cools simultaneously, the September meeting becomes highly live for a first cut.
Before December 8-9: October and November CPI, PCE, and jobs data all arrive in the preceding weeks. November data is especially valuable because it covers the full post-summer economic picture. December is historically the meeting where the Fed either delivers the cut it has been signaling or pushes it to January of the following year.
How Prediction Markets Price the 2026 FOMC Meeting Schedule
Prediction markets have become a genuine alternative data source for Fed watchers. Before FOMC meetings, Polymarket and Kalshi contracts on specific rate outcomes aggregate thousands of individual probability assessments in real time. The resulting market-implied odds frequently diverge from the "consensus" you read in financial media, and when they diverge significantly, history suggests the markets are often right.
At MacroOdds we do not just display the raw odds. We contextualize them against CME FedWatch, against the most recent dot plot, and against actual incoming data. The goal is to give you a dashboard view of every angle rather than a single number that can be misleading in isolation. Visit our Fed rate-cut probability page for the current breakdown by meeting.
One pattern worth internalizing: prediction markets tend to be overconfident about holds in the near-term meeting and underconfident about cuts at meetings six-plus months out. The "no change" contract for the very next meeting almost always trades at a premium to what actually happens across historical outcomes, because participants weight the most recent statement heavily. The outlier events, emergency cuts, surprise hikes, get almost no probability mass in advance. Keep that asymmetry in mind when reading any single odds figure.
Your FOMC Questions, Answered
Below we address the questions we see most often from readers tracking the 2026 FOMC meeting schedule. The dedicated FAQ section further down covers even more ground.
How many FOMC meetings are in 2026? Eight. The Fed holds eight regularly scheduled meetings per year. Unscheduled emergency meetings can occur between sessions but are rare and reserved for significant economic dislocations.
What time does the Fed decision come out? The policy statement releases at 2:00 p.m. Eastern on the second day of each meeting (always a Wednesday in 2026). The chair's press conference begins at 2:30 p.m. Eastern.
Which 2026 meetings have a dot plot? March 17-18, June 16-17, September 15-16, and December 8-9. These four meetings produce an updated Summary of Economic Projections including rate-path dots, GDP, unemployment, and inflation forecasts.
Frequently asked questions
When is the next FOMC meeting in 2026?
As of June 2026, the next FOMC meeting is June 16-17, 2026. The rate decision and policy statement release on Wednesday, June 17 at approximately 2:00 p.m. Eastern time. This is a dot-plot meeting, meaning the Fed will also release updated economic projections and the chair will hold a press conference at 2:30 p.m. Eastern.
How many FOMC meetings are there in 2026?
There are eight regularly scheduled FOMC meetings in 2026: January 27-28, March 17-18, April 28-29, June 16-17, July 28-29, September 15-16, October 27-28, and December 8-9. The Fed can also call unscheduled meetings in extraordinary circumstances, but those are rare.
What are all the FOMC meeting dates for 2026?
The eight 2026 FOMC meeting dates, sourced from federalreserve.gov, are: January 27-28, March 17-18, April 28-29, June 16-17, July 28-29, September 15-16, October 27-28, and December 8-9. The asterisked meetings (March, June, September, December) include the Summary of Economic Projections.
What time is the Fed decision announced at FOMC meetings?
The FOMC policy statement releases at exactly 2:00 p.m. Eastern time on the second day of each meeting. In 2026, day two falls on a Wednesday for all eight meetings. The Fed chair's live press conference begins at 2:30 p.m. Eastern and typically runs 45 to 60 minutes.
What is the FOMC dot plot and which 2026 meetings include it?
The dot plot is an anonymous chart showing where each FOMC member expects the federal funds rate to be at year-end for the current year and the next two to three years. It is published as part of the Summary of Economic Projections (SEP). In 2026, the dot plot releases at four meetings: March 18, June 17, September 16, and December 9.
Can the Fed cut rates at a non-dot-plot meeting?
Yes. Since 2019 the Fed chair holds a press conference after every single FOMC meeting, removing the practical constraint that previously made non-SEP meetings less likely action points. The FOMC can cut, hike, or hold rates at any of the eight scheduled meetings regardless of whether a dot plot is included.
Where can I find live odds for the next FOMC decision?
MacroOdds aggregates prediction-market probabilities from Polymarket and Kalshi on our Fed rate-cut probability page (/fed-rate-cut-probability). The CME Group's FedWatch tool also provides implied probabilities derived from fed funds futures contracts. Both update continuously as new economic data arrives.
What economic data does the FOMC watch most closely?
The Fed's dual mandate is maximum employment and price stability. The primary inflation gauge is core PCE (Personal Consumption Expenditures excluding food and energy), not CPI. For employment, the committee watches nonfarm payrolls, the unemployment rate, and wage growth from the monthly jobs report. Any significant surprise in either metric, especially inside the ten-day pre-meeting blackout period, can shift prediction-market odds sharply without a corresponding Fed response until the meeting itself.