Inflation Predictions 2027: 2.4% Needs a 130bp Fall
Every page that ranks for inflation predictions 2027 gives you a single number and no way to check it. One model site has May 2027 at 1.34%. The professional forecasters say 2.4%. The Fed's own projection says 2.3%. Nobody tells you that these are three different indices measured three different ways, or which of them you could actually put money behind.
That gap matters more than usual this week. The Philadelphia Fed published its new forecaster survey yesterday, the Fed's next projection round lands on December 9, and the last twelve-month CPI reading anybody can compute is September's 3.72%, because October's does not exist.
So here is what I did instead of averaging the forecasts. I rebuilt the CPI and PCE series from FRED to get the real run rates, pulled the live Polymarket inflation ladder and every CPI series Kalshi lists, read the Treasury's own order setting a replacement index for the month that was never measured, and decomposed the breakeven curve into the year-by-year path it implies.
The short version: nothing that trades today points at 2.4% for 2027. The forecaster consensus is a forecast of disinflation that has not begun, and the one month that would have told us whether it had begun was never collected.
Inflation Predictions 2027: The Short Answer
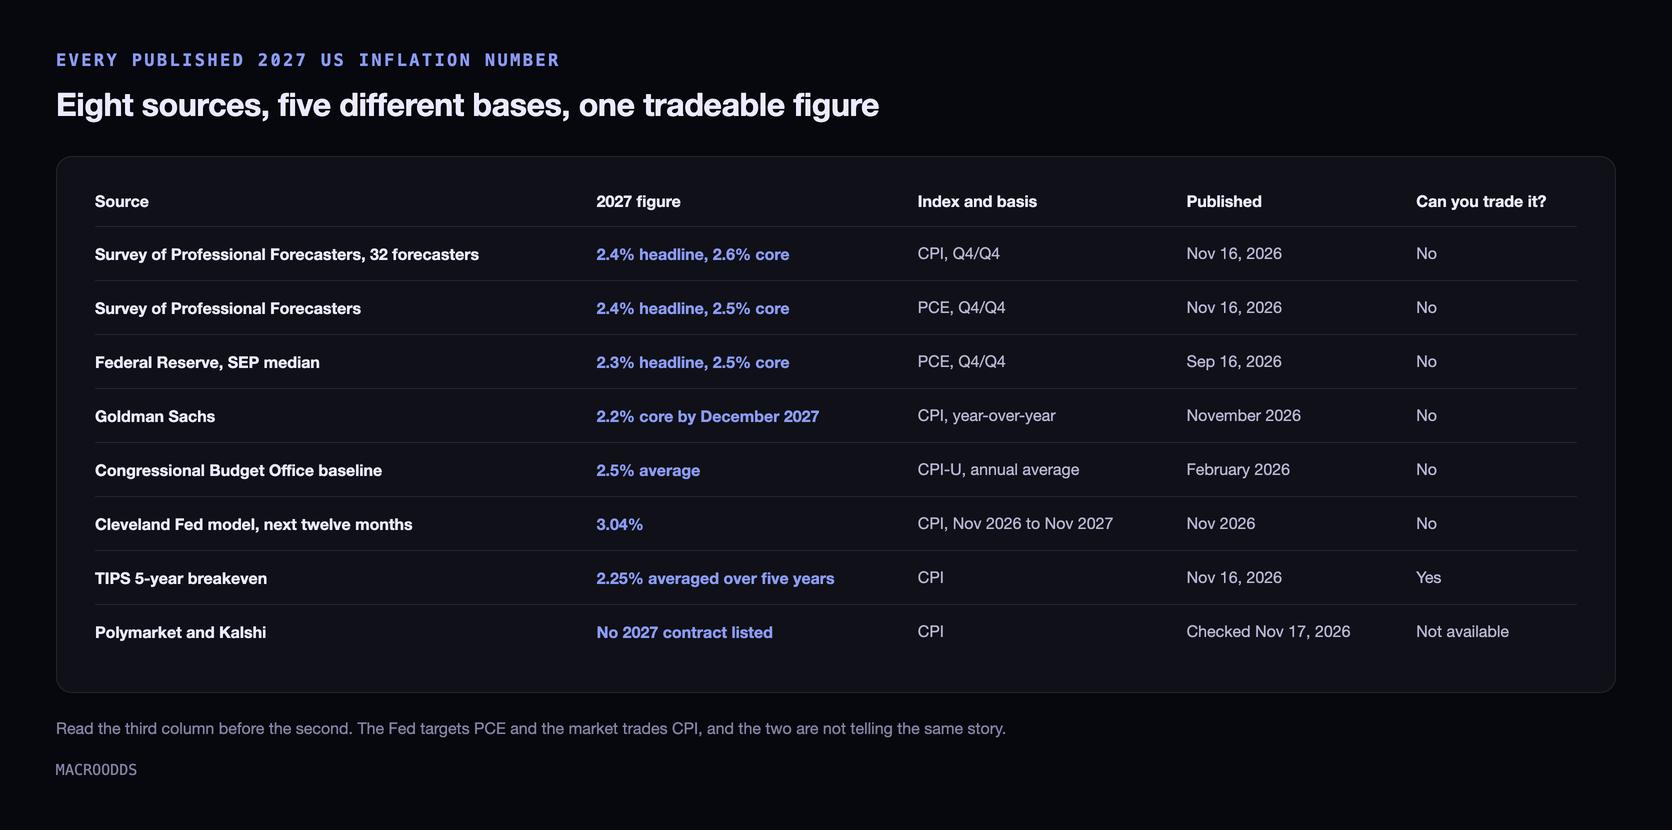
Six institutions and two models have a 2027 number. They span 2.2% to 3.04%, which sounds narrow until you remember that the Fed's target is 2% and the difference between the top and bottom of that range is most of a rate decision.
| Source | 2027 figure | Index and basis | Published | Can you trade it? |
|---|---|---|---|---|
| Survey of Professional Forecasters, 32 forecasters | 2.4% headline, 2.6% core | CPI, Q4/Q4 | Nov 16, 2026 | No |
| Survey of Professional Forecasters | 2.4% headline, 2.5% core | PCE, Q4/Q4 | Nov 16, 2026 | No |
| Federal Reserve, SEP median | 2.3% headline, 2.5% core | PCE, Q4/Q4 | Sep 16, 2026 | No |
| Goldman Sachs | 2.2% core by December 2027 | CPI, year-over-year | November 2026 | No |
| Congressional Budget Office baseline | 2.5% average | CPI-U, annual average | February 2026 | No |
| Cleveland Fed model, next twelve months | 3.04% | CPI, Nov 2026 to Nov 2027 | Nov 2026 | No |
| TIPS 5-year breakeven | 2.25% averaged over five years | CPI | Nov 16, 2026 | Yes |
| Polymarket and Kalshi | No 2027 contract listed | CPI | Checked Nov 17, 2026 | Not available |
Every published 2027 US inflation number I could source, with the index and basis each one uses. SPF figures are from the Q4 2026 survey released November 16, 2026; Fed medians from the September 16, 2026 projection table. The Goldman and CBO figures are attributed to their published reporting rather than fetched from a primary table. Mixing these without the third column is the mistake almost every forecast roundup makes.
Read the third column before the second. The Fed targets PCE and the market trades CPI, and right now those two indices are not telling the same story: core PCE is running at 3.12% while core CPI is running at 2.57%. The index the Fed cares about is 55 basis points hotter than the one the contracts settle on. Our CPI versus PCE breakdown covers why the two diverge.
Where US Inflation Actually Is Right Now
A 2027 forecast is a claim about how far inflation falls from here, so the starting point does the work. The honest answer is that the starting point depends on which window you measure, and the windows disagree sharply.
| Measure | Latest 12-month change | 3-month annualized | 6-month annualized |
|---|---|---|---|
| Headline CPI | +3.72% (September) | +5.72% | +3.07% |
| Core CPI | +2.57% (September) | +3.75% | +2.69% |
| Headline PCE | +3.65% (September) | +3.56% | +3.34% |
| Core PCE | +3.12% (September) | +2.90% | +2.92% |
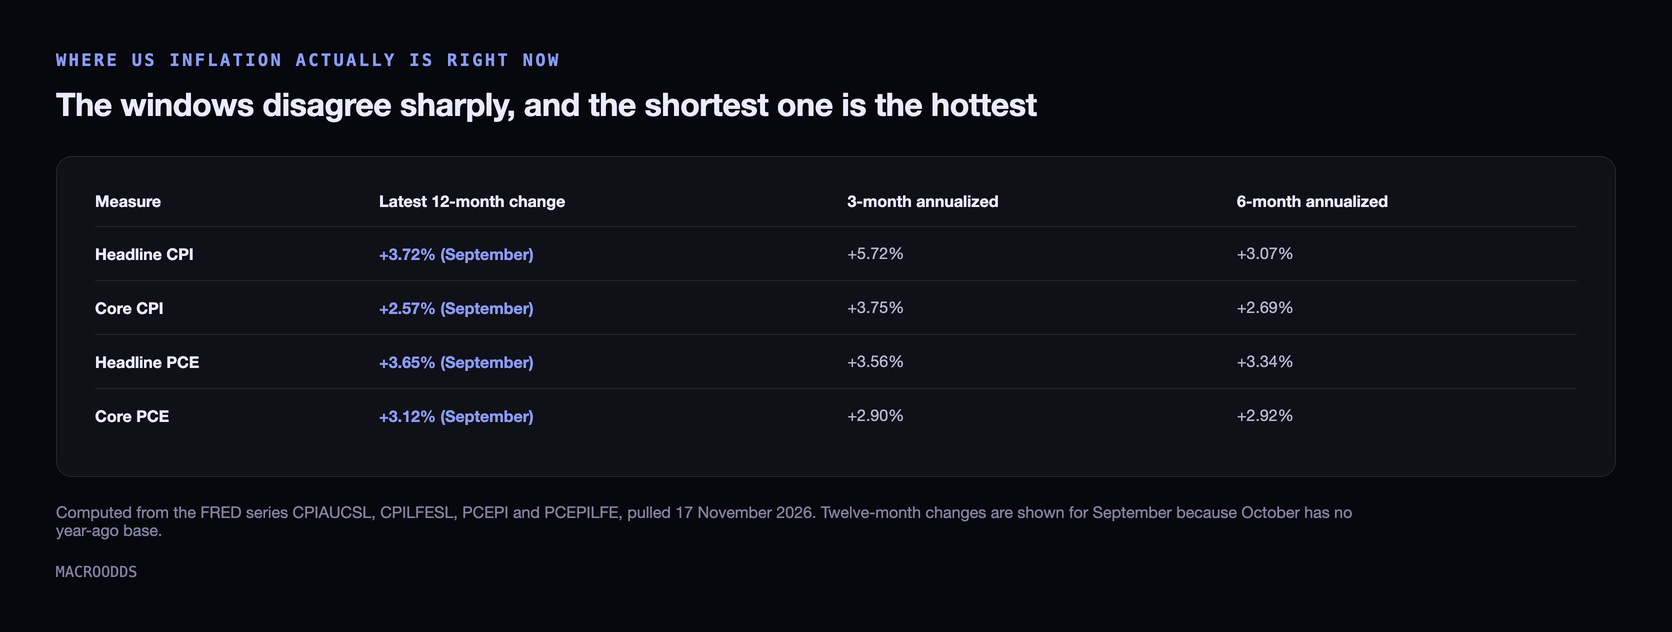
Computed from the FRED series CPIAUCSL, CPILFESL, PCEPI and PCEPILFE, pulled November 17, 2026. CPI runs through October 2026, PCE through September. Twelve-month changes are shown for September because October has no year-ago base, which the next section explains.
The three-month annualized headline rate of 5.72% is the number that should stop you. It is not a typo and it is not the whole story either: it is dominated by one month, because energy prices rose 5.20% in September alone and the energy index has run at a 36.8% annualized pace over the last three months after falling 5.7% in June.
Strip energy out and core CPI is still accelerating, from a 2.69% six-month pace to a 3.75% three-month pace. That is the part that cannot be blamed on oil, and it is the part a 2.4% forecast for next year has to reverse. The core PCE tracker follows the measure the Fed actually targets.
The Month That Does Not Exist
Here is the thing no forecast roundup mentions. The October 2025 Consumer Price Index was never published, because the 43-day federal shutdown that began on October 1, 2025 stopped the collection, and prices cannot be collected after the fact. The CPI is not built on respondent recall, so a missed month is missed permanently.
The BLS says so in plain terms on its shutdown FAQ: it "did not issue an October 2025 CPI news release", for most series "October 2025 indexes were not published", and it viewed retroactive collection as "both costly and potentially inaccurate". The consequence lands exactly one year later. In the agency's own words, BLS "will not publish 12-month percent changes for October 2026 for indexes where October 2025 data are not available."
So the October 2026 report came out with an index level of 337.511 and no annual inflation rate beside it. If you want one, you have to invent the base, and the choice is not cosmetic.
| Base chosen for October 2025 | Index value | Implied October 2026 annual CPI |
|---|---|---|
| US Treasury contingency index (official, permanent) | 325.604 | +3.66% |
| Carry forward September 2025 actual | 324.800 | +3.91% |
| Linear interpolation of September and November 2025 | 324.461 | +4.02% |
| Use November 2025 actual | 324.122 | +4.13% |
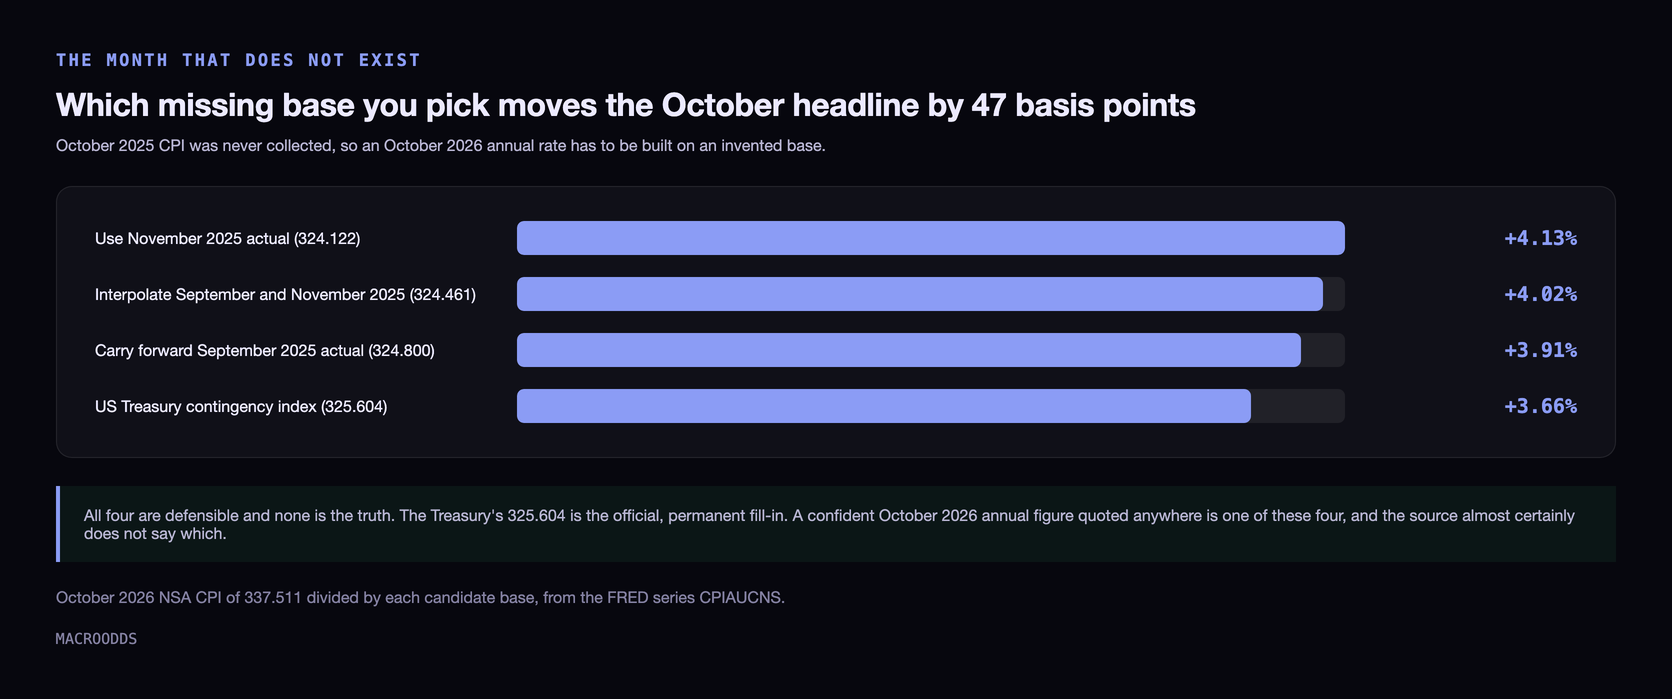
My own arithmetic, from the FRED series CPIAUCNS: October 2026 NSA CPI of 337.511 divided by each candidate base. September 2025 (324.800) and November 2025 (324.122) are real published values. The 325.604 figure is the Treasury's, explained below.
That is a 47 basis point spread on the headline inflation rate, produced entirely by a methodological choice about a month nobody measured. Every one of those four numbers is defensible. If you see a confident October 2026 annual inflation figure quoted anywhere, it is one of these four and the source almost certainly does not say which.
The Number the Treasury Invented So TIPS Could Keep Paying
There is one official October 2025 CPI index, and the statistical agency did not produce it. The Treasury did, because it had no choice: Treasury Inflation-Protected Securities adjust their principal off the CPI, and a missing month would have left coupon payments undefined.
On November 26, 2025 the Treasury invoked the index contingency provisions in its Uniform Offering Circular, at Appendix B to 31 CFR Part 356, and announced that "the index number for October 2025 is 325.604". The order carries a clause worth reading twice: Treasury "will not replace this index number even if BLS subsequently reports actual CPI for October 2025".
This matters for a 2027 forecast because the TIPS market is where the only tradeable long-horizon inflation numbers come from. The breakevens I use later in this piece are differences between nominal and inflation-linked yields, and the inflation-linked leg carries a legally fixed synthetic index for one month of 2025 that the statistical record will never contain.
You Cannot Trade 2027 Inflation Yet
I checked both exchanges on November 17, 2026 expecting to find a 2027 inflation ladder to quote. There is not one. Polymarket's longest-dated US inflation market resolves on December 10, 2026, and Kalshi's year-over-year CPI series stops at its December 2026 event, which closes on January 13, 2027.
What does trade is the near-term print, and it is worth knowing where that sits before believing a forecast of a steep fall. Polymarket's November annual inflation market has $40,104 of volume against $124,215 of liquidity, and the distribution is tight.
| Strike | Price | Normalized probability | Volume |
|---|---|---|---|
| 3.5% or below | 0.45c to 4.70c | 5.4% combined | $6,465 |
| 3.6% | 18.50c | 17.6% | $4,527 |
| 3.7% | 38.50c | 36.7% | $6,968 |
| 3.8% | 35.50c | 33.8% | $6,156 |
| 3.9% | 4.50c | 4.3% | $5,182 |
| 4.0% or above | 0.20c to 0.75c | 2.1% combined | $12,806 |
Polymarket event 1376034, "November Inflation US - Annual", read from the Gamma API on November 17, 2026. Raw prices sum to 105%, so the third column is normalized. The implied mean is 3.72% and 88.1% of the probability mass sits between 3.6% and 3.8%.
The traded mean for November is 3.72%, which is September's rate to two decimal places. The market is not pricing the beginning of a decline. For context, the separate 2026 peak-inflation market has already settled above 4% on $1.57m of volume, and still prices a 9% chance that 2026 inflation touches 4.5%.
One structural detail is worth recording, because it is the cleanest evidence that the missing month is real rather than an accounting curiosity. Kalshi lists month-over-month CPI contracts for October 2026 and they settled normally, with the "rose more than 0.3%" strike resolving yes. Its year-over-year ladder has events for August, September, November and December 2026 and no October event at all. The exchange simply skipped the month it could not resolve.
What the Bond Market Prices for 2027
With no 2027 contract to read, the breakeven curve is the only market-based answer, and it has been falling while realized inflation rises. That divergence is the single most interesting thing on the board.
| Measure | Nov 16, 2026 | Nov 13, 2026 | What window it covers |
|---|---|---|---|
| 5-year TIPS breakeven | 2.25% | 2.30% | Average CPI, 2026 to 2031 |
| 10-year TIPS breakeven | 2.20% | 2.24% | Average CPI, 2026 to 2036 |
| 5-year, 5-year forward breakeven | 2.15% | 2.18% | Average CPI, 2031 to 2036 |
| Cleveland Fed model, 1 year | 3.04% (November) | 2.98% (October) | Nov 2026 to Nov 2027 |
| Cleveland Fed model, 2 year | 2.87% (November) | 2.88% (October) | Nov 2026 to Nov 2028 |
| Cleveland Fed model, 5 year | 2.72% (November) | 2.78% (October) | Nov 2026 to Nov 2031 |
| University of Michigan, 1 year ahead | 4.6% (September) | 4.0% (August) | Consumer expectations |
Breakevens from the FRED series T5YIE, T10YIE and T5YIFR; model expectations from the Cleveland Fed series EXPINF1YR, EXPINF2YR and EXPINF5YR; survey from MICH. Pulled November 17, 2026. As a cross-check, the 10-year nominal less the 10-year real yield on November 13 gives 5.15% minus 2.91%, which is the 2.24% in the table.
Two features of that table do real work. First, the breakeven curve slopes down: five-year 2.25%, ten-year 2.20%, and the far forward segment lowest of all at 2.15%. The market is pricing today's inflation as a bump that does not persist.
Second, the near-term expectations are moving the other way. The Cleveland Fed's one-year number has gone from 2.40% in August to 3.04% in November, a 64 basis point rise in three months, while its five-year and ten-year numbers fell over the same stretch. Short-run expectations up, long-run expectations down, is the signature of a market that believes a central bank will eventually win.
The 64 Basis Point Gap Between Consensus and Curve
Now put the forecasts and the curve on the same basis, which almost nobody does. The SPF's 2.4% is a Q4-over-Q4 figure for calendar 2027. The Cleveland Fed's 3.04% covers November 2026 to November 2027. Those windows are within weeks of each other, so the two numbers are directly comparable, and they differ by 64 basis points.
| Horizon | Implied annual CPI | Derived from |
|---|---|---|
| Year 1: Nov 2026 to Nov 2027 | 3.04% | Cleveland Fed 1-year expectation |
| Year 2: Nov 2027 to Nov 2028 | 2.69% | 1-year and 2-year expectations |
| Years 3 to 5: 2028 to 2031 | 2.62% | 2-year and 5-year expectations |
| Years 6 to 10: 2031 to 2036 | 2.61% | 5-year and 10-year expectations |
| SPF forecast for the same year 1 window | 2.40% | Q4/Q4 2027 CPI, published Nov 16, 2026 |
| Gap between the two | 0.64pp | Model less forecaster consensus |
My decomposition, compounding the Cleveland Fed expectation series into non-overlapping forward segments rather than reading the headline averages. The year-2 figure, for example, is the 2-year expectation squared divided by the 1-year expectation.
The traded breakeven looks like it sides with the forecasters at 2.25%, and this is the trap. A five-year average of 2.25% that begins with a year at 3.04% requires the remaining four years to average 2.05%, which is below target for four years running with no overshoot at all. The breakeven and the forecast agree on the average and disagree completely about the path.
There is also a premium in that gap rather than pure disagreement. The Cleveland Fed's five-year model expectation of 2.72% sits 47 basis points above the five-year breakeven of 2.25%, and that wedge is compensation for inflation risk and TIPS liquidity, not a forecast. Treat the breakeven as the market's risk-adjusted price and the model as its central estimate, and the honest range for 2027 is roughly 2.4% to 3.0%.
What Would Have to Happen for 2.4% to Be Right
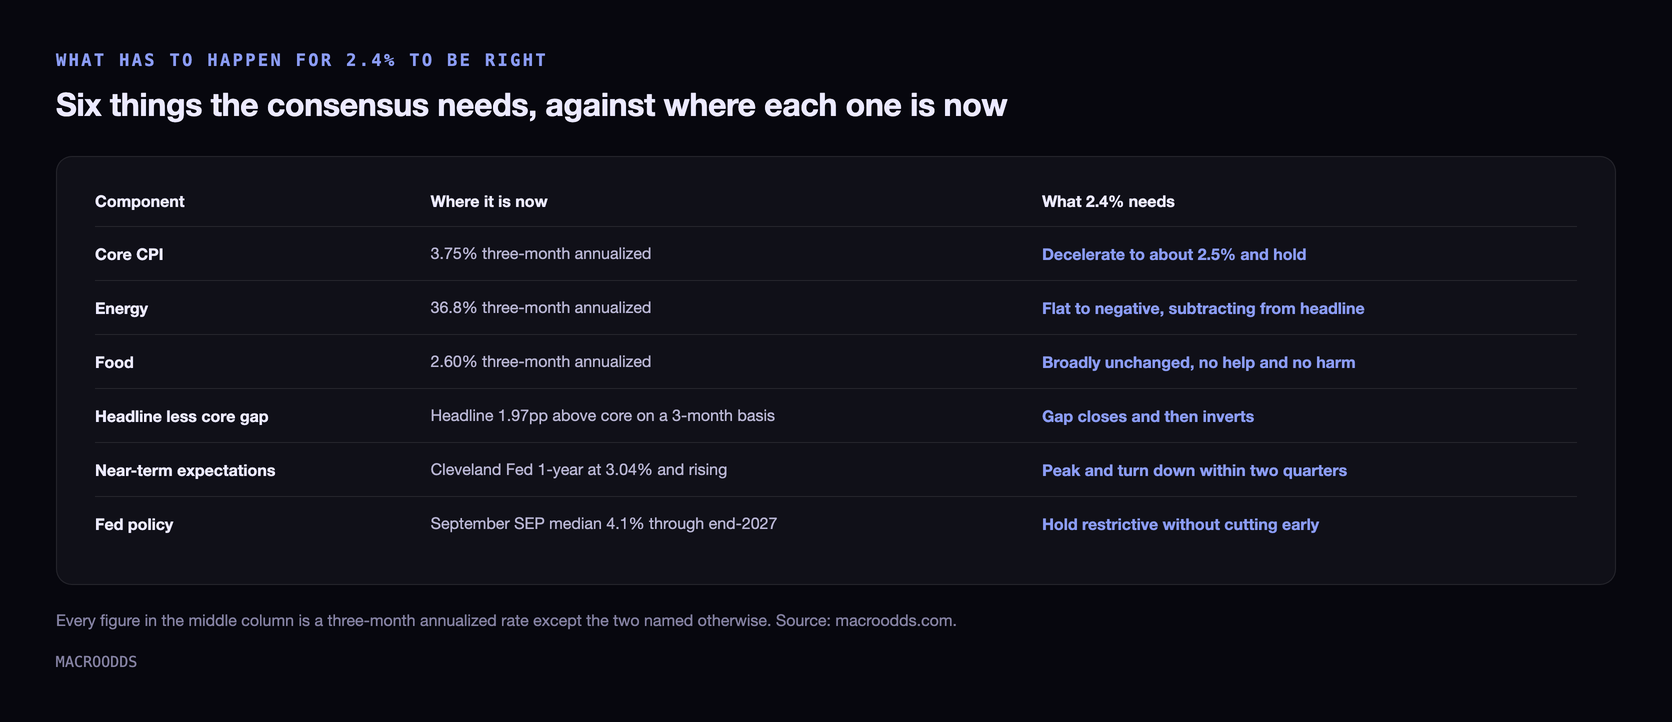
A forecast is only useful if you know what would falsify it. So here is the 2.4% consensus turned into component claims you can check month by month through 2027.
| Component | Where it is now | What 2.4% needs |
|---|---|---|
| Core CPI | 3.75% three-month annualized | Decelerate to about 2.5% and hold |
| Energy | 36.8% three-month annualized | Flat to negative, subtracting from headline |
| Food | 2.60% three-month annualized | Broadly unchanged, no help and no harm |
| Headline less core gap | Headline 1.97pp above core on a 3-month basis | Gap closes and then inverts |
| Near-term expectations | Cleveland Fed 1-year at 3.04% and rising | Peak and turn down within two quarters |
| Fed policy | September SEP median 4.1% through end-2027 | Hold restrictive without cutting early |
The 2.4% Q4/Q4 CPI consensus decomposed into the component paths it implies. Current readings computed from FRED series CPILFESL, CPIENGSL, CPIUFDSL and EXPINF1YR on November 17, 2026.
Notice the oddity in the forecaster numbers themselves: the SPF puts headline CPI at 2.4% for 2027 and core CPI at 2.6%. Headline below core is a forecast that energy subtracts from inflation next year, which is a real view, but it is a view about oil rather than about the labour market or the Fed.
My reading is that 2.4% is achievable and not central. It needs core to shed more than a full percentage point from its current three-month pace while energy reverses a 36.8% annualized run, and it needs that process to begin almost immediately. The traded November print of 3.72% says it has not begun yet, and the December dot plot will be the first official read on whether the committee still believes it.
How to Follow This Into 2027
Four dates settle most of this question, and the first two fall within a month.
| Date | Release | Why it matters for 2027 |
|---|---|---|
| December 9, 2026 | FOMC decision and Summary of Economic Projections | First official revision of the 2.3% PCE projection for 2027 |
| December 10, 2026 | November CPI | First computable annual rate since September; resolves the Polymarket ladder |
| January 2027 | December CPI | Closes 2026 and sets the Q4/Q4 base the SPF and Fed forecasts are measured from |
| March 2027 | FOMC projections | First 2027 SEP, and the point where a 2.4% path is either visible or not |
FOMC dates from the Federal Reserve's published calendar; the November CPI date matches the resolution date on Polymarket's November annual inflation market.
I would watch two things rather than the headline. The three-month annualized core rate, because it turns before the annual rate does, and the Cleveland Fed one-year expectation, because it has risen for three consecutive months and a peak there is the earliest sign the consensus is right. Our release calendar carries every date above, and the CPI inflation prediction page tracks the live market odds as each print lands.
Frequently asked questions
What are the inflation predictions for 2027?
The forecaster consensus is 2.4%. The Survey of Professional Forecasters, published November 16, 2026, puts Q4-over-Q4 2027 CPI at 2.4% and core CPI at 2.6%, and the Federal Reserve's September 2026 projection median has 2027 PCE inflation at 2.3%. Market-informed models are higher: the Cleveland Fed's expected CPI inflation for the twelve months to November 2027 is 3.04%. Goldman Sachs is the low end at 2.2% core CPI by December 2027.
Why is there no October 2026 inflation rate?
Because there is no October 2025 figure to compare it with. The 43-day federal shutdown that began October 1, 2025 stopped CPI data collection, and the BLS does not collect prices retroactively, so most October 2025 indexes were never published. The BLS states that it will not publish 12-month percent changes for October 2026 for indexes where October 2025 data are not available. The October 2026 index level of 337.511 was published normally.
What is the current US inflation rate?
The last published twelve-month headline CPI reading is 3.72% for September 2026, with core CPI at 2.57%. On the measure the Fed targets, headline PCE was 3.65% and core PCE 3.12% in September. Shorter windows are hotter: headline CPI has run at a 5.72% annualized pace over the last three months and core CPI at 3.75%.
Can you bet on 2027 inflation on Polymarket or Kalshi?
Not as of November 17, 2026. Polymarket's longest-dated US inflation market resolves December 10, 2026, and Kalshi's year-over-year CPI ladder stops at its December 2026 event, which closes January 13, 2027. The only market-based 2027 inflation numbers come from TIPS breakevens, where the 5-year sat at 2.25% on November 16, 2026.
What does the TIPS breakeven say about inflation in 2027?
Less than it first appears. The 5-year breakeven of 2.25% is an average over 2026 to 2031, not a 2027 forecast, and the curve slopes down, with the 10-year at 2.20% and the 5-year 5-year forward at 2.15%. If the first of those five years runs at the Cleveland Fed's expected 3.04%, the remaining four have to average 2.05% for the breakeven to be right.
Why did the Treasury publish its own October 2025 CPI number?
Because TIPS principal adjusts with the CPI and a missing month would leave payments undefined. On November 26, 2025 the Treasury used the index contingency provisions in Appendix B to 31 CFR Part 356 and set the October 2025 index at 325.604. It stated it will not replace that number even if the BLS later reports an actual October 2025 CPI, so it is permanent.
Will inflation go back to 2% in 2027?
Nothing currently traded says so. Reaching the forecaster consensus of 2.4%, let alone 2%, needs core CPI to fall more than a percentage point from its current 3.75% three-month annualized pace while energy reverses a 36.8% annualized run. The traded market prices November 2026 inflation at 3.72%, which is unchanged from September, so the disinflation the 2027 forecasts require has not started in the data yet.
Why do CPI and PCE inflation forecasts for 2027 differ?
They measure different baskets with different weights, so they routinely diverge. In September 2026 core PCE ran at 3.12% while core CPI ran at 2.57%, meaning the index the Fed targets was 55 basis points hotter than the one prediction markets settle on. That is why a 2.3% PCE projection from the Fed and a 2.4% CPI forecast from the SPF are not the same claim about 2027.
Sources
- Federal Reserve Bank of Philadelphia, Survey of Professional Forecasters, Q4 2026 (released November 16, 2026; 32 forecasters; Q4/Q4 2027 CPI 2.4%)
- US Treasury, index contingency provisions for TIPS (October 2025 index set at 325.604, November 26, 2025)
- Federal Reserve Bank of Cleveland, Inflation Expectations model (1-year 3.04%, 5-year 2.72%, November 2026)
- Federal Reserve, Summary of Economic Projections, September 16, 2026 (2027 PCE inflation median 2.3%, core 2.5%)
- Federal Reserve, FOMC calendars and meeting dates (December 8-9, 2026)