Core PCE Inflation 2026: Markets Say 3.4%

Core PCE inflation is the number the Federal Reserve actually targets, and every page ranking for it right now will tell you what it did in June or July. None of them will tell you what the next one is going to be, beyond a single model point estimate with no error bar attached. I pulled both Polymarket core PCE books and the Kalshi ladder this evening, set them against the Cleveland Fed's nowcast and the index arithmetic from the BEA's own series, and found the two Polymarket books disagreeing with each other by more than either disagrees with anybody else.
The stakes are unusually specific this month. The August report lands at 08:30 Eastern on Wednesday September 30, and the September report is scheduled for October 29, which is the morning after the Federal Open Market Committee announces its decision. Wednesday's number is therefore the last reading on the Fed's preferred gauge that the committee gets before it votes, and as of this afternoon that vote is a coin flip.
Below is where each book sits, the index arithmetic that converts a monthly forecast into an annual bucket, which of the two Polymarket markets the arithmetic supports, and what each outcome does to an October decision that repriced by 23 points in the last four hours. All prices were captured on September 29, 2026 at 21:22 UTC.
Where the Core PCE Inflation Market Sits Before the Print
Polymarket runs the August core PCE annual rate as a ladder of seven separate binary contracts, one per tenth. Each is priced independently, so the raw column does not sum to 100%. Here is the whole book, with the normalised column that is the honest probability and the best bid and ask so you can see which quotes are real.
| August core PCE, year over year | Last price | Normalised | Best bid / ask | Volume |
|---|---|---|---|---|
| 3.0% or lower | 5.25% | 5.40% | 4c / 6.5c | $4,958 |
| 3.1% | 6.50% | 6.69% | 4c / 9c | $17,458 |
| 3.2% | 23.50% | 24.18% | 12c / 35c | $16,850 |
| 3.3% | 28.00% | 28.81% | 26c / 30c | $6,879 |
| 3.4% | 31.00% | 31.89% | 29c / 33c | $10,670 |
| 3.5% | 2.45% | 2.52% | 0.6c / 4.3c | $4,231 |
| 3.6% or higher | 0.50% | 0.51% | no bid / 1c | $3,382 |
| Implied total | 97.20% | 100% | $64,428 |
Polymarket event "Core PCE YoY - August 2026", captured September 29, 2026 at 21:22 UTC. The raw column sums to 97.2%, an underround, which is itself a sign that nobody is working this book hard.
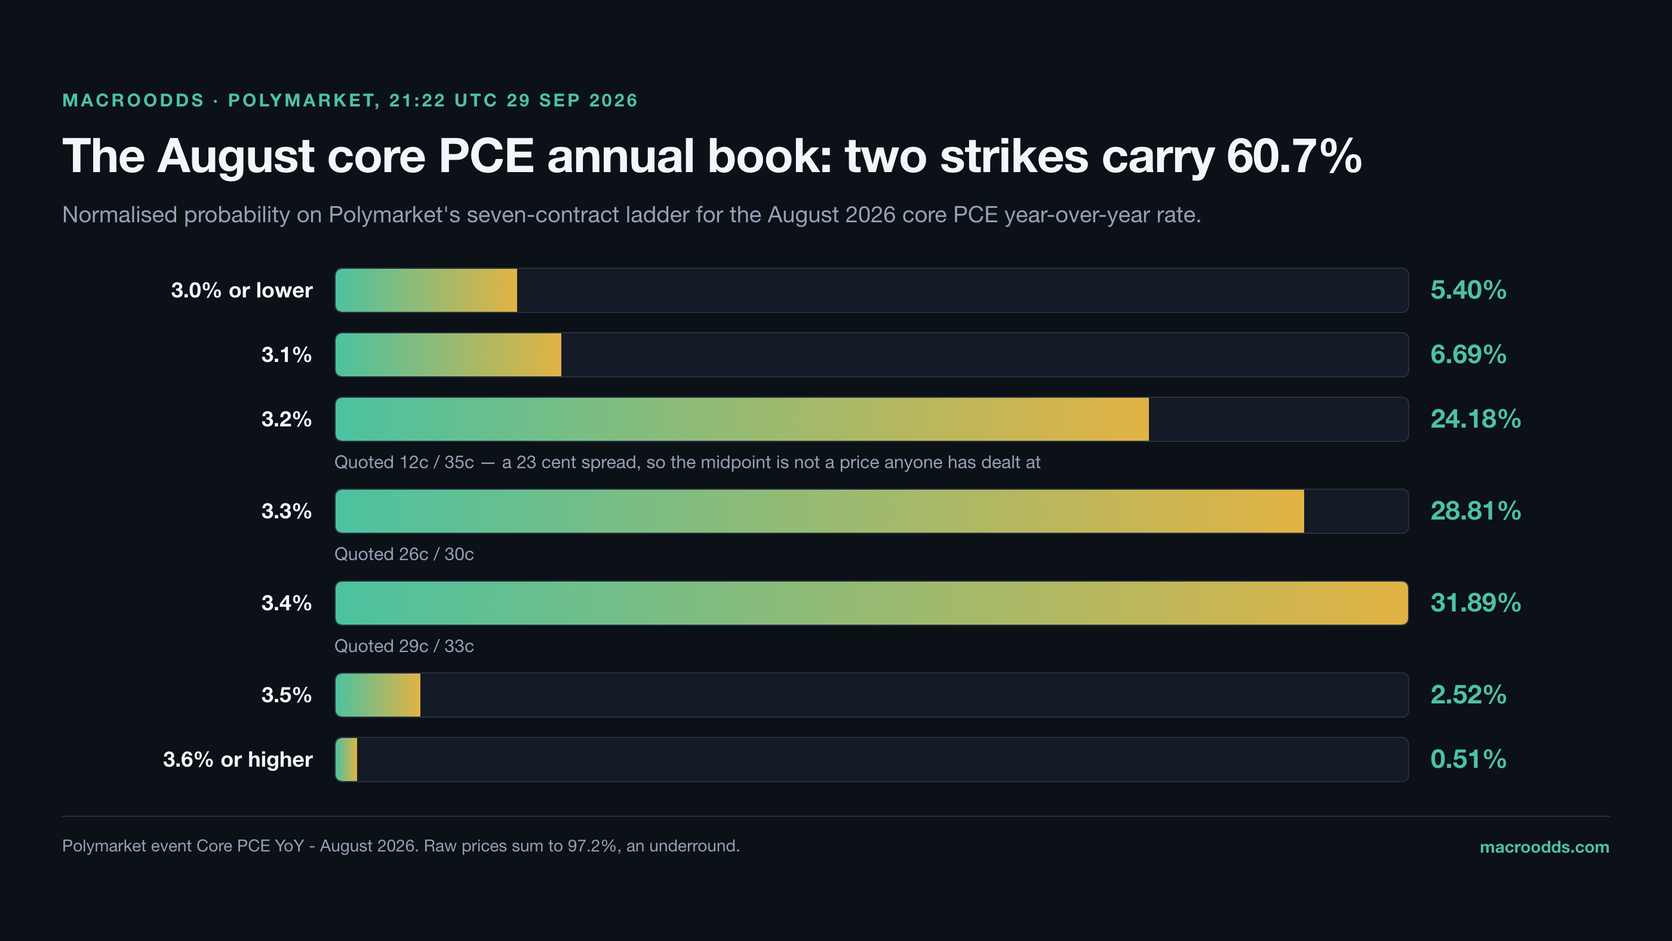
Look at the bid-ask column before you look at the probabilities. Only two strikes on this ladder have a tight quote: 3.3% at 26 to 30 cents and 3.4% at 29 to 33 cents. Those are the two the market is genuinely trading, and between them they carry 60.7% of the normalised mass.
The 3.2% strike is a different animal. Its quote runs from 12 cents to 35 cents, a 23 cent spread, and the 23.5% figure sitting in the middle of it is a midpoint rather than a price anyone has agreed to. That single strike carries almost a quarter of the book's probability on a number nobody will actually deal at, which is worth remembering for the next four sections.
The Month-Over-Month Book Says Something Different
Polymarket runs a second market on the same release: the seasonally adjusted monthly change in core PCE, again as a ladder of independent binaries. It is a smaller book at $22,495 of volume, but it is the one with a properly liquid centre.
| August core PCE, month over month | Last price | Normalised | Best bid / ask | Volume |
|---|---|---|---|---|
| -0.1% or lower | 0.05% | 0.05% | no bid / 0.1c | $851 |
| 0.0% | 0.05% | 0.05% | no bid / 0.1c | $857 |
| 0.1% | 0.50% | 0.49% | no bid / 1c | $1,463 |
| 0.2% | 15.00% | 14.63% | 2c / 28c | $7,980 |
| 0.3% | 70.50% | 68.78% | 69c / 72c | $8,372 |
| 0.4% | 14.90% | 14.54% | 1.4c / 28.4c | $1,402 |
| 0.5% or higher | 1.50% | 1.46% | 1c / 2c | $1,569 |
| Implied total | 102.50% | 100% | $22,495 |
Polymarket event "Core PCE MoM - August 2026", same capture. The 0.3% strike is quoted 69 to 72 cents, the tightest spread anywhere across either core PCE book.
This book has one strong opinion and it is well supported: +0.3% on the month at 68.8% normalised, quoted inside three cents. The wings at 0.2% and 0.4% are both wide and thin, so treat their 14.6% and 14.5% as placeholders rather than measurements.
Now hold that 68.8% next to the previous table. A monthly increase of 0.3% against July's level is not a number that leaves the annual rate where it is. Working out exactly where it puts the annual rate takes two lines of arithmetic, and those two lines are the whole article.
The Index Arithmetic That Settles the Core PCE Inflation Question
Both contracts resolve on figures the BEA rounds to one decimal place, so each bucket is an interval on the underlying index, not a point. The July 2026 core PCE index stands at 130.658 and the August 2025 base is 126.714, which puts July's annual rate at 3.3441%, reported as 3.3%.
Solve for the rounding edges rather than rounding a single point estimate. The 3.35% boundary sits at an index level of 130.9589, the 3.25% boundary at 130.8322, and so on. Divide each by July's 130.658 and you get the monthly change that each annual outcome requires.
| August annual rate | Required August index | Required monthly change | Seen in the last 12 months? |
|---|---|---|---|
| 3.1% | 130.5788 to 130.7055 | -0.061% to +0.036% | No, not once |
| 3.2% | 130.7055 to 130.8322 | +0.036% to +0.133% | No, not once |
| 3.3% | 130.8322 to 130.9589 | +0.133% to +0.230% | Yes, five times |
| 3.4% | 130.9589 to 131.0856 | +0.230% to +0.327% | Yes, four times |
| 3.5% | 131.0856 to 131.2123 | +0.327% to +0.424% | Yes, twice |
| 3.6% or higher | 131.2123 and above | +0.424% and above | Yes, once |
Derived from the BEA core PCE price index, July 2026 level 130.658 and August 2025 level 126.714. Boundaries are the rounding edges at 3.05%, 3.15%, 3.25%, 3.35%, 3.45% and 3.55%, not rounded point estimates. The right-hand column counts the twelve seasonally adjusted monthly changes from August 2025 to July 2026.
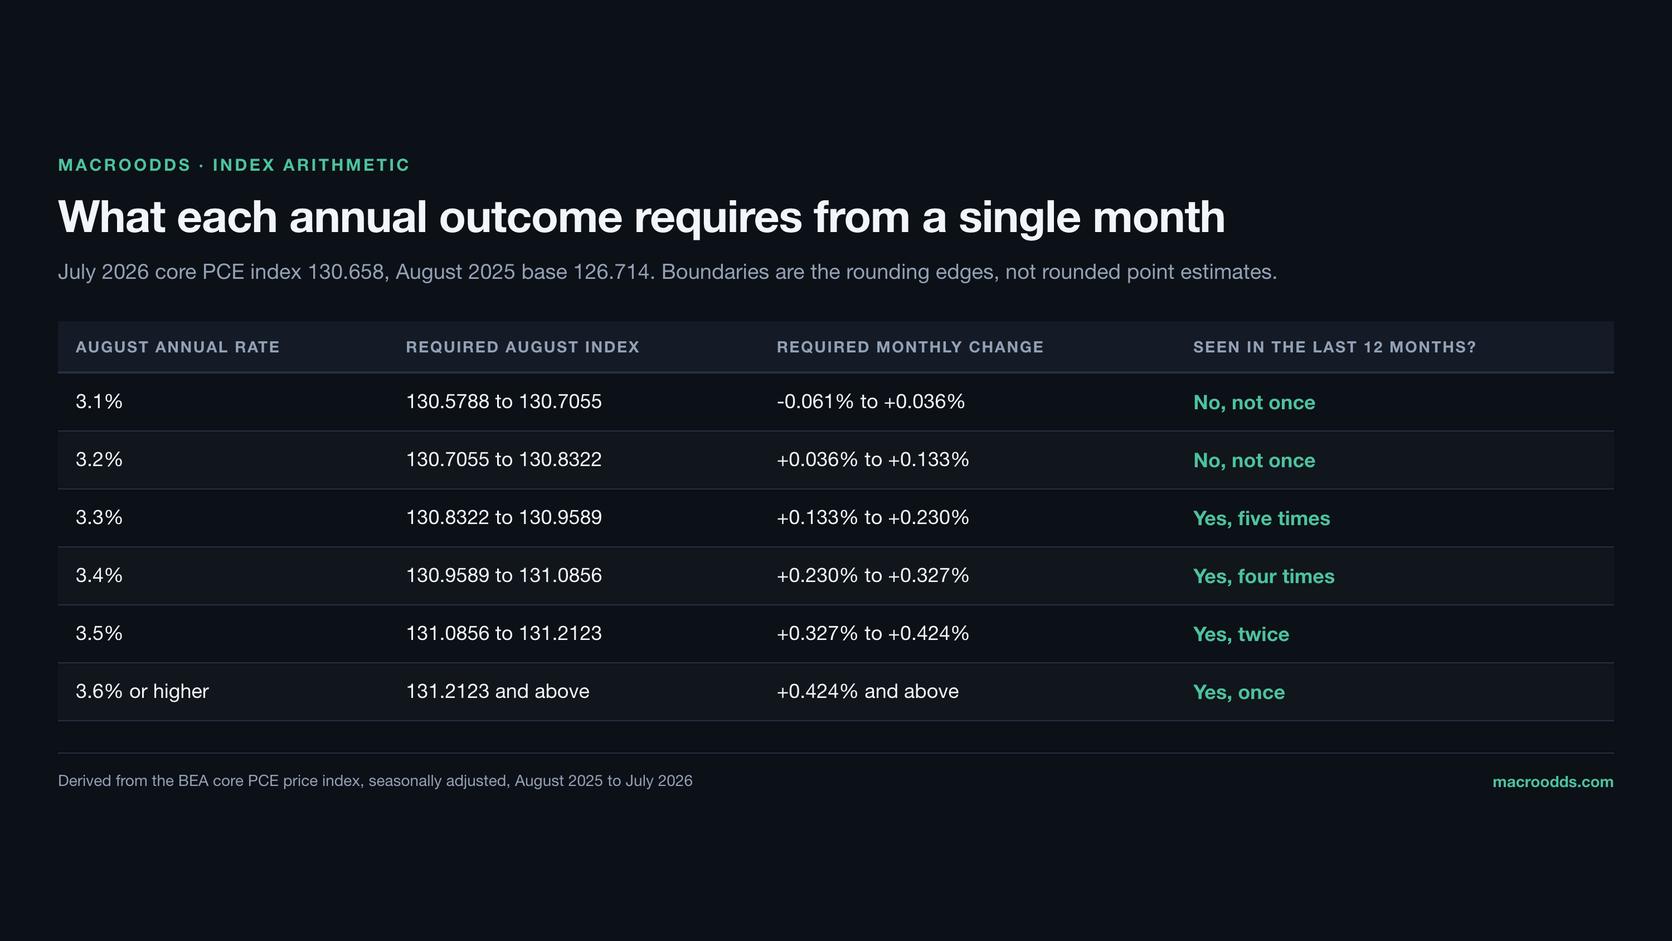
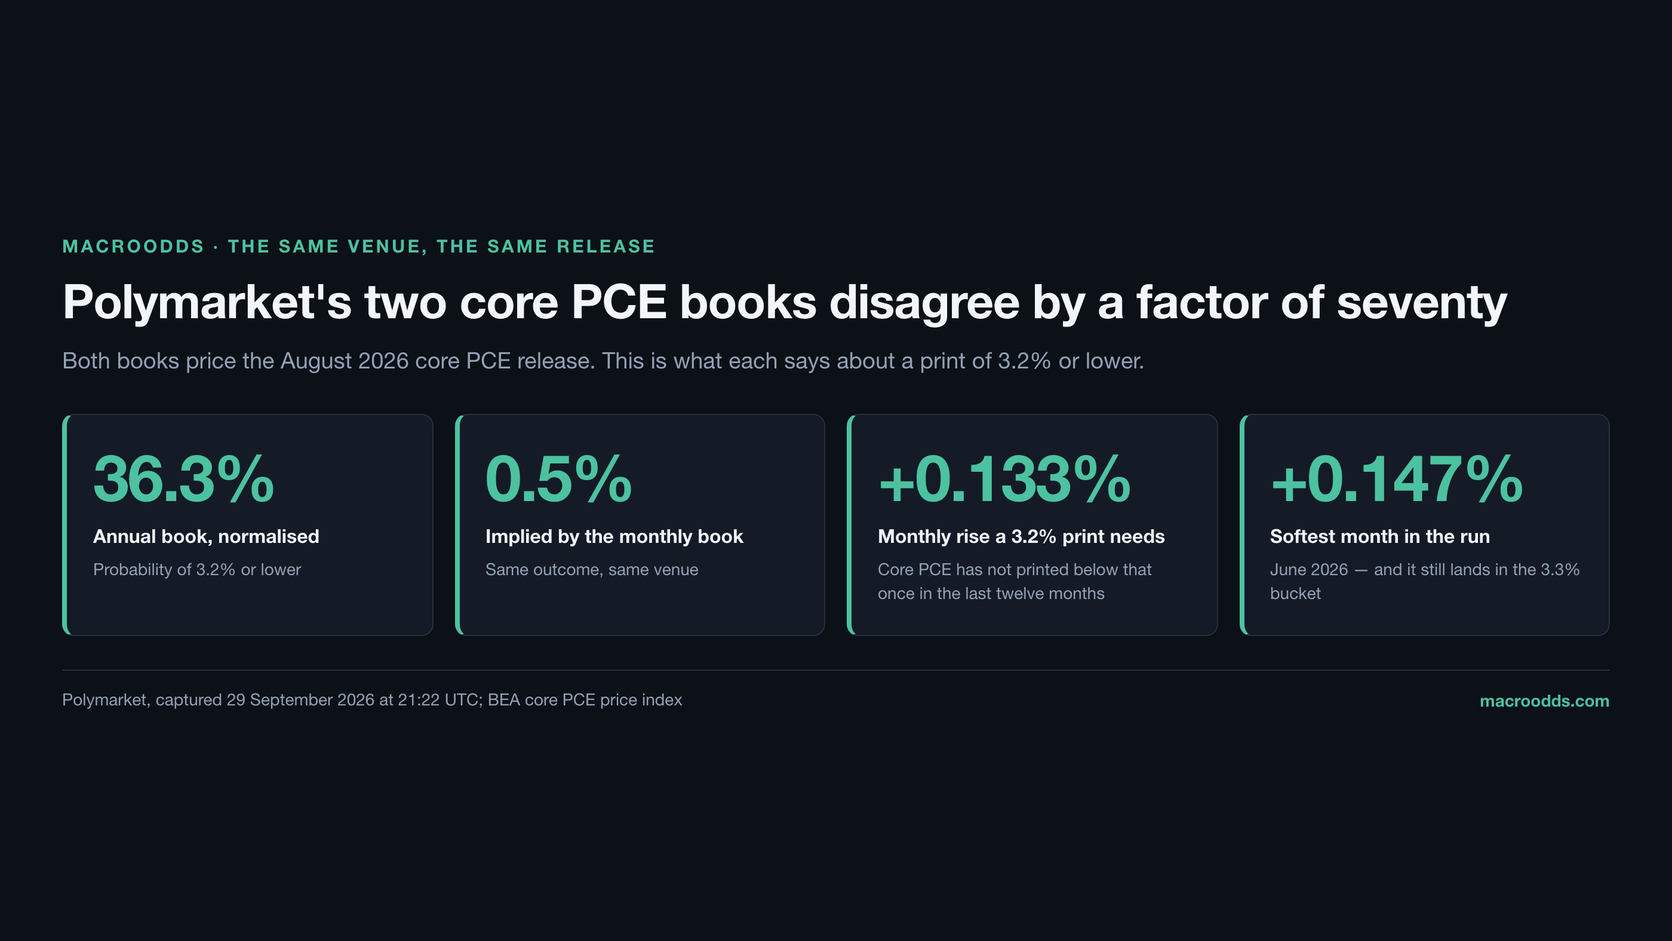
The right-hand column is the part that should stop you. A 3.2% annual print requires a monthly core increase below +0.133%, and core PCE has not done that once in the last twelve months. The softest month in the run was June 2026 at +0.147%, which still lands in the 3.3% bucket. The three-month average is +0.251% and the twelve-month average is +0.275%, both of which sit squarely in 3.4%.
So the annual book is putting 24.2% on an outcome that needs a monthly print softer than anything in a year, while the venue's own monthly book prices that same softness at half a percent. One of those two markets is wrong, and the arithmetic does not leave much doubt about which.
Reconciling the Two Books, Bucket by Bucket
Map each monthly bucket onto the annual bands from the table above, assume the true value is uniformly distributed inside each reported tenth, and the monthly book converts directly into an annual distribution. Here it is against the annual book the same venue is quoting.
| August core PCE outcome | Annual book (normalised) | Implied by the monthly book | Gap |
|---|---|---|---|
| 3.0% or lower | 5.40% | 0.05% | 5.4 pts |
| 3.1% | 6.69% | 0.04% | 6.6 pts |
| 3.2% | 24.18% | 0.42% | 23.8 pts |
| 3.3% | 28.81% | 11.83% | 17.0 pts |
| 3.4% | 31.89% | 56.05% | 24.2 pts |
| 3.5% | 2.52% | 26.42% | 23.9 pts |
| 3.6% or higher | 0.51% | 5.20% | 4.7 pts |
| Cumulative 3.2% or lower | 36.27% | 0.51% | 35.8 pts |
| Cumulative 3.5% or higher | 3.03% | 31.61% | 28.6 pts |
Polymarket's own two core PCE books, reconciled through the index arithmetic. Both columns are normalised to 100%. The two cumulative rows are the same disagreement stated twice.
The annual book is priced as though July's rate were 3.1%. It is 3.3%. That single stale anchor explains the whole shape: a book that thinks the starting point is two tenths lower naturally puts a fat lump on 3.2% and almost nothing on 3.5%.
Two honest caveats before anyone treats the right-hand column as gospel. The uniform-within-bucket assumption is a simplification, and it matters most at the edges. More importantly, the August release revises July as well as publishing August, so the bridge between the two books carries revision noise that the annual comparison against the August 2025 base does not.
Neither caveat is worth 35 points. A revision large enough to close that gap would itself be the story of the release.
What the Cleveland Fed Nowcast Says
The Cleveland Fed publishes a daily inflation nowcast for both PCE and CPI, and it is the third venue any serious inflation preview should check. It updated this morning, September 29, which makes it the freshest independent estimate available before the release.
| Measure | Cleveland Fed nowcast | Month over month | Which annual bucket that implies |
|---|---|---|---|
| August 2026 core PCE | 3.40% | +0.27% | 3.4% |
| August 2026 headline PCE | 3.78% | +0.34% | 3.8% |
| September 2026 core PCE | 3.49% | +0.28% | 3.5% |
| September 2026 headline PCE | 3.97% | +0.44% | 4.0% |
| September 2026 core CPI | 2.39% | +0.20% | n/a |
Federal Reserve Bank of Cleveland inflation nowcasting, updated September 29, 2026. The right-hand column applies the rounding-edge table above to the nowcast's monthly figure, as a consistency check on the nowcast itself.
The nowcast passes its own consistency check. A +0.27% month lands in the 3.4% band, and the Cleveland Fed's separate annual nowcast is 3.40%. Its two independent estimates agree with each other and with the arithmetic, which is exactly what you want from a third source and exactly what Polymarket's pair of books fails to do.
Note the row below it too. The Cleveland Fed already has September core PCE running at 3.49%, which rounds up rather than down. If that holds, core inflation is not flat at the moment the committee is deciding whether to go again. It is drifting.
Kalshi Prices Headline PCE, Not Core, This Month
Kalshi lists two PCE series, KXPCECORE for core and KXPCEHEAD for headline. The core series has no open market for this release at all, which is the single most useful thing I learned tonight: the cross-venue check that works on CPI simply is not available on core PCE in September 2026.
What Kalshi does run is a cumulative headline ladder on the monthly change, and it is thin. Roughly 2,400 contracts have traded across the whole ladder, against 790,625 of open interest on a single October Fed strike, so read it as a hint rather than a measurement.
| Kalshi strike (August headline PCE) | Bid | Ask | Last | Volume | Open interest |
|---|---|---|---|---|---|
| Above 0.0% | 97c | 100c | no trade | 0 | 0 |
| Above 0.1% | 84c | 88c | 87c | 148 | 148 |
| Above 0.2% | 79c | 93c | no trade | 0 | 0 |
| Above 0.3% | 25c | 38c | 40c | 1,196 | 862 |
| Above 0.4% | 5c | 10c | 4c | 547 | 547 |
| Above 0.5% | 0c | 10c | no trade | 0 | 0 |
| Above 0.7% | 0c | 3c | 3c | 512 | 507 |
Kalshi series KXPCEHEAD-26SEP30, captured September 29, 2026 at 21:22 UTC. Only one strike, "above 0.3%", has meaningful flow behind it.
The one strike with real flow prices a 31.5% chance that headline PCE beats 0.3% on the month, against the Cleveland Fed's +0.34% nowcast. So Kalshi's traders sit slightly cooler than the Cleveland Fed on headline, which is the opposite of the September CPI setup, where Kalshi carried the fatter upside tail.
Headline matters less to the committee than core does, and it matters less this month than usual, because the September energy move lands mostly in next month's reference period. I would not trade this ladder. I would use it only to sanity-check the direction.
Why This Print Decides October and Not December
The Fed raised its target range to 3.75% to 4.00% in September, its first increase since 2023, and the vote was unanimous. Markets spent the following ten days treating October as close to settled. Then this afternoon happened.
| Time (UTC), September 29 | October: 25bp hike | December: 25bp hike | October-to-December spread |
|---|---|---|---|
| 00:00 to 14:00 | 68.5% | 76.5% to 77.0% | 8 to 8.5 pts |
| 15:00 | 64.5% | 76.0% | 11.5 pts |
| 17:00 to 18:00 | 67.5% | 76.0% to 76.5% | 9 pts |
| 19:00 | 47.5% | 74.5% | 27 pts |
| 21:22 (capture) | 44.5% | 75.5% | 31 pts |
| Kalshi, same capture | 42.5% (mid) | n/a |
Polymarket CLOB hourly price history for the "25 bps increase" contracts on the October and December Fed decision events, with the Kalshi October cross-check. Polymarket's October book carries $17.3m of volume; Kalshi's October hike and hold strikes carry 790,625 and 838,157 contracts of open interest.
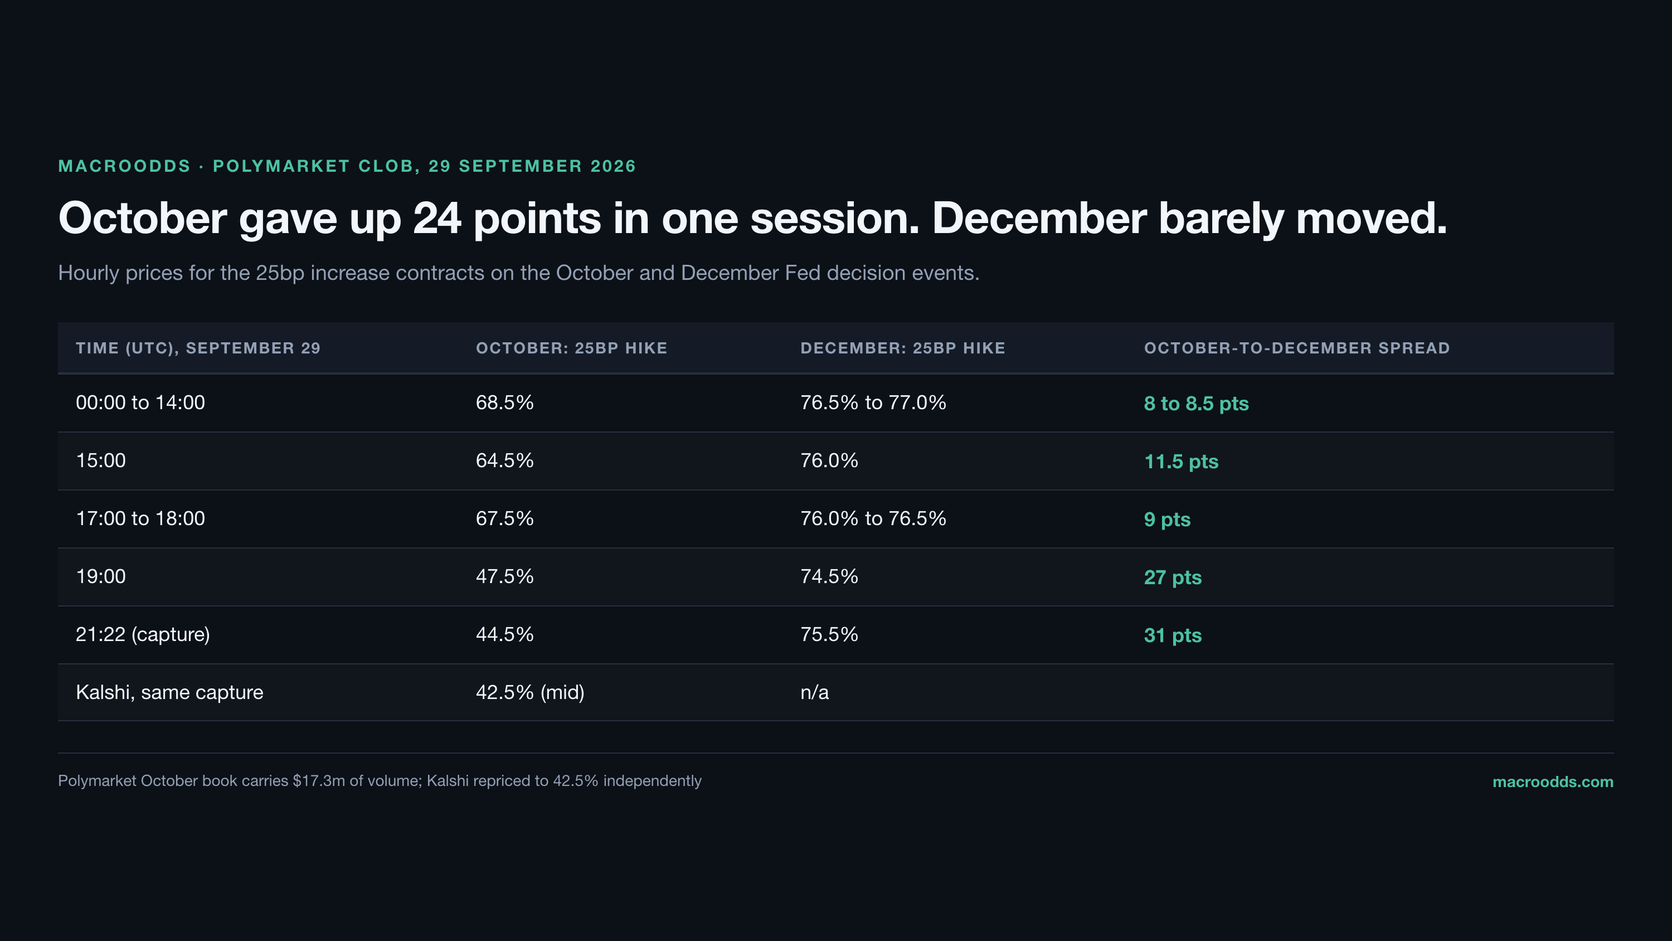
Two things to take from that table. First, the move is real rather than a book artefact: Kalshi repriced to 42.5% independently, within two points of Polymarket, on a market with well over a million contracts of open interest across the two main strikes. Second, and more interesting, December barely flinched. It gave up two points in the hour October gave up twenty, and it has since recovered most of that.
The market has moved the hike, not cancelled it. The October-to-December spread went from 8 points to 31 points in a single session, which is a statement about timing rather than about the path of rates.
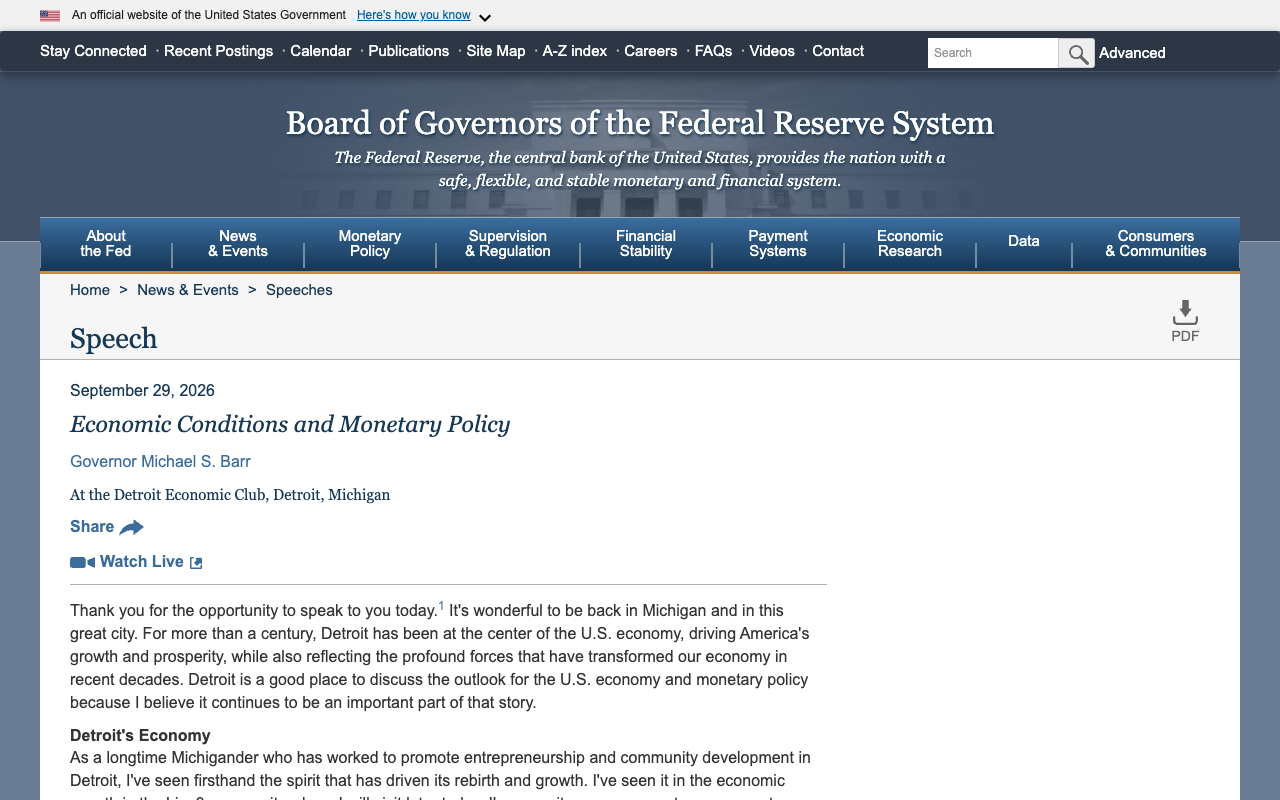
I cannot tell you for certain what triggered it, and I am not going to invent a reason. The only monetary-policy event on the Board's calendar that day was Governor Michael Barr in Detroit at 12:40pm Eastern, and his prepared text reads hawkish: he said plainly that "what is clear right now is that inflation is too high" and that in his base case "further policy adjustments are likely to be needed". If the repricing came from that appearance it came from the conversation around the text rather than the text itself. What I can tell you is precisely what moved, what did not, and that both venues moved together.
What Each Core PCE Outcome Does to the Fed
With October at a coin flip, Wednesday's number carries more than it usually would. Barr framed the problem in exactly these terms in Detroit: "I count only two months of data consistent with 2 percent core PCE inflation over the past 20 months." That is a committee counting core PCE months, not CPI months.
| August core PCE prints | Monthly change implied | Read-across | Likely effect on October |
|---|---|---|---|
| 3.2% or lower | Below +0.133% | Softest core month in over a year | Hike odds well below 30% |
| 3.3% | +0.133% to +0.230% | Annual rate unchanged, momentum cooling | Roughly where it is now |
| 3.4% | +0.230% to +0.327% | The modal call, and a tick up in the annual rate | Firms back towards 55% to 60% |
| 3.5% | +0.327% to +0.424% | Two ticks up, fastest since 2023 | Hike becomes the base case again |
| 3.6% or higher | +0.424% and above | A genuine upside shock | Talk turns to a larger move |
Read-across from each annual bucket, using the required monthly change from the rounding-edge table. The October column is my judgement, not a quoted market price.
The asymmetry matters here. The annual book gives only 3.0% to a print of 3.5% or higher, while the monthly book and the Cleveland Fed's September nowcast both point at exactly that sort of drift. If there is a mispriced tail into Wednesday morning, it is the upside one, and it is mispriced on the market with the loosest quotes.
One risk that is genuinely off the table: the release itself. Polymarket's two independent contracts on a funding lapse at the October 1 deadline trade at 0.45% and 0.6%, so unlike the October 2025 episode that erased a CPI print entirely, the data calendar looks safe this year.
How to Read the Report on Wednesday Morning
The BEA publishes Personal Income and Outlays at 08:30 Eastern. Here is the order I read it in, and why.
- The core monthly figure, before the annual one. The annual rate is arithmetic applied to a base that is twelve months old. The monthly change is the only new information in the release, and it is what the rounding-edge table above turns into an annual outcome.
- The revision to July. The release restates prior months. A July revised from 130.658 shifts the monthly change that produces any given annual print, which is the one thing that can break the bridge between Polymarket's two books.
- Headline against core. A hot headline driven visibly by energy moves the committee less than a warm core does. Barr's twenty-month count was a core count.
- Services excluding housing and energy. The narrowest measure of domestic price pressure in the report, and the line most likely to be quoted in the next round of Fed speeches.
- The October contract between 08:30 and 09:00 Eastern. Whatever the number is, the fastest read on what it means is what the $17.3m October book does with it in the first half hour.
My own view, for the record: I think 3.4% is right and the annual book is wrong, and I think it is wrong for a boring reason rather than a clever one. It is anchored to a starting point two tenths below the actual July rate, and the 12-to-35 cent spread on its pivotal strike tells you nobody has bothered to correct it. The monthly book, the Cleveland Fed and the index arithmetic all point at the same answer, and when three independent methods agree while a fourth disagrees on the widest quote in the market, the fourth is usually the odd one out.
Frequently asked questions
What is core PCE inflation?
Core PCE is the price index for personal consumption expenditures excluding food and energy, published monthly by the Bureau of Economic Analysis. It is the Federal Reserve's preferred inflation gauge, and the 2% target in the Fed's statement of longer-run goals refers to total PCE, with core watched as the better guide to the underlying trend. It differs from CPI in its weights, its coverage and its treatment of substitution, and it typically runs a few tenths below CPI.
What is the core PCE inflation prediction for August 2026?
As of September 29, 2026, Polymarket's annual book makes 3.4% the modal outcome at 31.9% normalised, with 3.3% at 28.8% and 3.2% at 24.2%. The Cleveland Fed nowcasts 3.40%. Polymarket's separate month-over-month book puts 68.8% on a +0.3% monthly increase, which the index arithmetic converts to roughly 56% on a 3.4% annual print. The report is released at 08:30 Eastern on Wednesday September 30, 2026.
When is the next core PCE report released?
The August 2026 Personal Income and Outlays release, which contains core PCE, is published by the BEA at 08:30 Eastern on Wednesday September 30, 2026. The September 2026 release is scheduled for October 29, 2026, which is the morning after the Federal Open Market Committee announces its October decision.
What was core PCE inflation in July 2026?
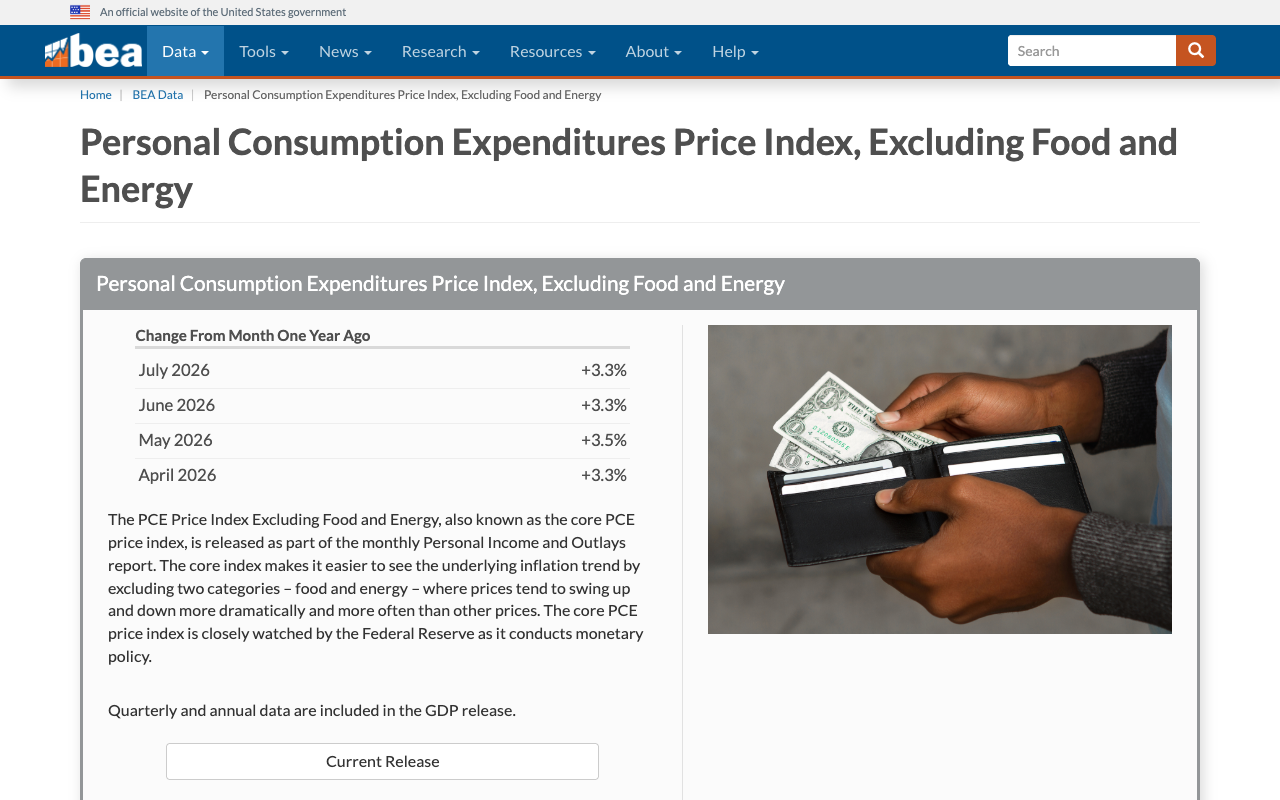
Core PCE rose 3.3% in the twelve months to July 2026, unchanged from June. The underlying index level was 130.658 against 126.430 a year earlier, an unrounded annual rate of 3.3441%. The seasonally adjusted monthly increase was +0.246%, and the annual rate has now held at or above 3.3% for several consecutive months against a 2% target.
Why do Polymarket's two core PCE markets disagree?
They are priced on the same release but by different flow, and the annual book is anchored to a stale starting point. It prices as though July's annual rate were 3.1% when it is 3.3%, which fattens the 3.2% bucket and starves the 3.5% one. The pivotal 3.2% strike is quoted 12 cents to 35 cents, so its 23.5% midpoint is not a price anyone has dealt at. The monthly book's key strike is quoted inside three cents and is the more reliable of the two.
Is core PCE or CPI more important to the Fed?
Core PCE. The Fed's 2% objective is defined on PCE, and Fed officials frame progress in core PCE terms. Governor Michael Barr told an audience in Detroit on September 29, 2026 that he counts only two months of data consistent with 2 percent core PCE inflation over the past 20 months. CPI still matters to markets because it is released earlier in the month and feeds directly into the PCE estimate.
What does the August core PCE print mean for the October Fed decision?
It is the last reading on the Fed's preferred gauge before the October 27 to 28 meeting, because the September release does not arrive until October 29. As of this capture Polymarket prices an October hike at 44.5% and Kalshi at 42.5%, both down roughly 23 points from this morning. A 3.5% print would likely restore the hike as the base case, while 3.2% or lower would push those odds well below 30%.
Could a government shutdown delay the core PCE report?
It looks very unlikely this year. Polymarket's two independent contracts on a lapse in federal appropriations at the October 1 deadline trade at 0.45% and 0.6%. That is a sharp contrast with October 2025, when a lapse stopped price collection and erased a monthly CPI release outright, leaving a permanent hole in a series published continuously since 1921.