CPI Prediction September 2026: Markets Say 3.6%

Every inflation preview you can find gives you one number and a shrug. The CPI prediction market gives you a distribution, and right now that distribution is doing something worth looking at: three independent sources agree almost perfectly on core inflation for September 2026 and cannot agree at all on the headline. I pulled the full outcome ladders from Polymarket's Gamma API and Kalshi's public market endpoints this evening, set them against the Cleveland Fed's nowcast and the underlying index arithmetic from FRED, and the gap is entirely energy.
That matters more than usual this month. The September report is released on October 14, thirteen days before the Federal Open Market Committee meets on October 27 and 28, and it is the last inflation print the committee sees before it votes. October hike odds have already slipped from 56.4% to 53.0% in four days. Two tenths on core moves that number more than anything else on the calendar.
Below is where every book sits, the index arithmetic that has to hold for a 3.6% print to happen, why gasoline explains the whole argument, and what each outcome does to the Fed. All prices were captured on September 22, 2026 at 21:20 UTC.
September CPI Prediction: Where the Market Sits Today
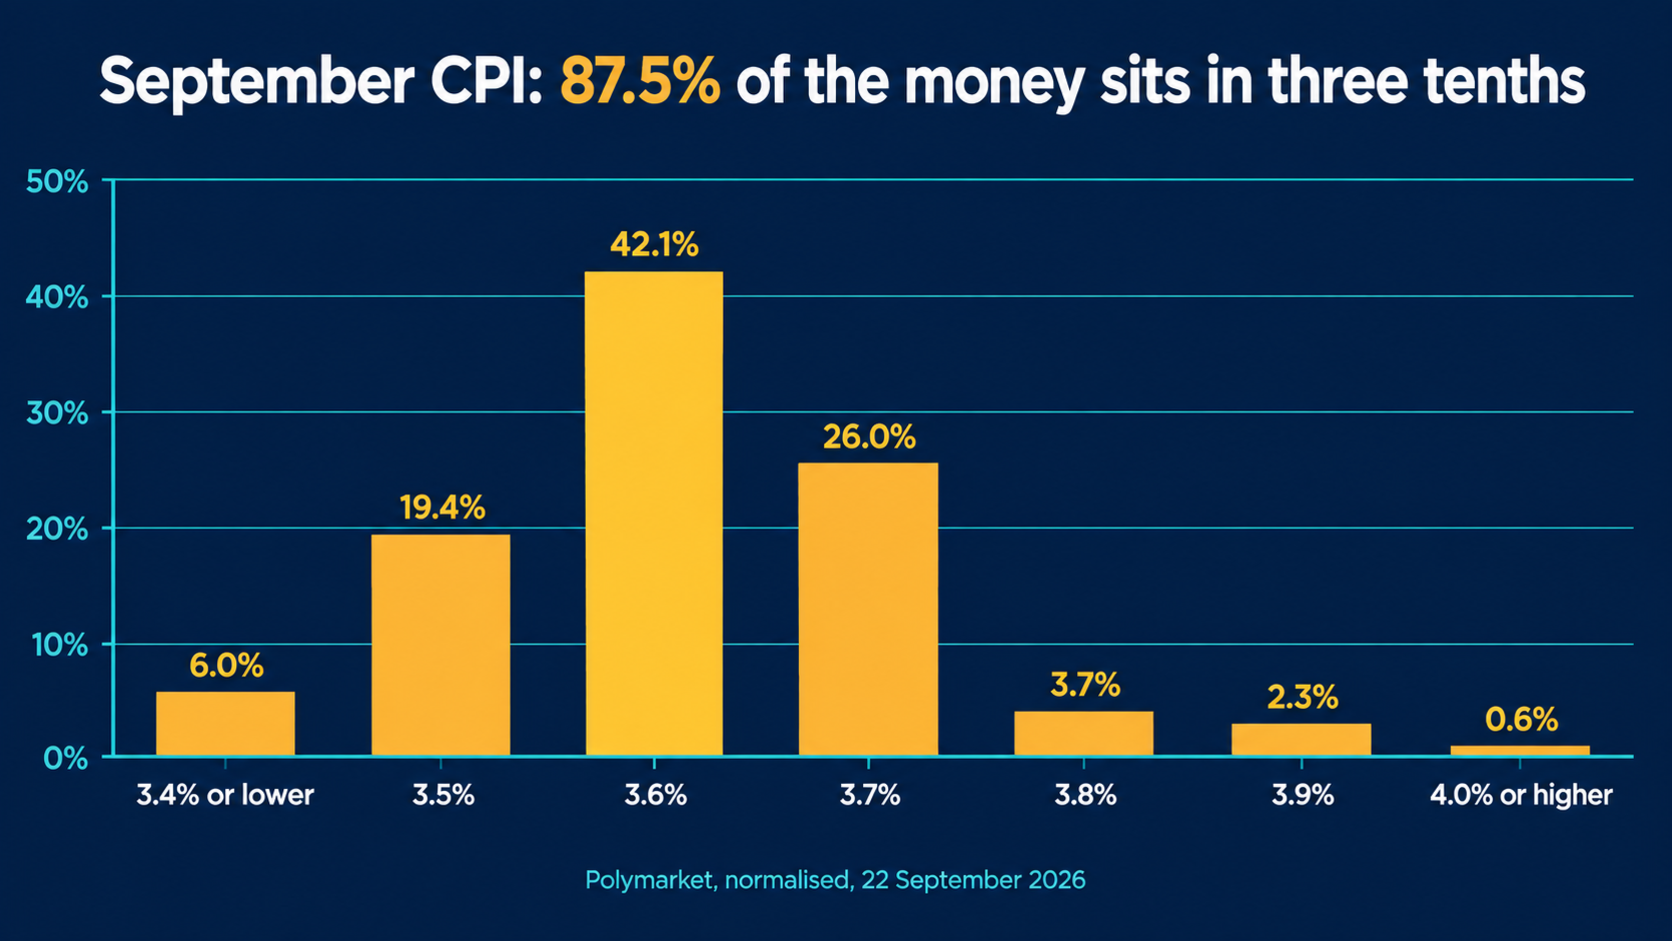
Polymarket runs the September headline print as a ladder of twelve separate binary contracts, one per tenth. Each is priced independently, so the column does not sum to 100%. Here is the whole book, with the normalised column that is the honest probability.
| September headline CPI, year over year | Polymarket last price | Normalised | Market volume |
|---|---|---|---|
| 3.4% or lower | 6.3% | 6.0% | $15,363 |
| 3.5% | 20.5% | 19.4% | $14,571 |
| 3.6% | 44.5% | 42.1% | $10,962 |
| 3.7% | 27.5% | 26.0% | $7,007 |
| 3.8% | 3.9% | 3.7% | $4,178 |
| 3.9% | 2.5% | 2.3% | $2,511 |
| 4.0% or higher | 0.7% | 0.6% | $2,358 |
| Implied total | 105.8% | 100% | $56,950 |
Polymarket event "September Inflation US - Annual", captured September 22, 2026, 21:20 UTC. The raw column sums to 105.8% because each tenth is a separate binary contract and the spread belongs to the house. The 3.4% or lower row aggregates six thinly traded buckets.
Two things stand out. The first is how tight the distribution is: 87.5% of the probability mass sits in three tenths, 3.5% through 3.7%. The second is that the modal outcome, 3.6%, is two tenths above the 3.4% that August printed, so the market is not pricing a steady month. It is pricing an acceleration.
The book is also small. At $56,950 of total volume this is a fraction of the $10.1 million sitting on the October Fed decision, so treat it as a well-informed estimate rather than a measurement. That is exactly why the second venue matters.
Polymarket and Kalshi Disagree About the Upside
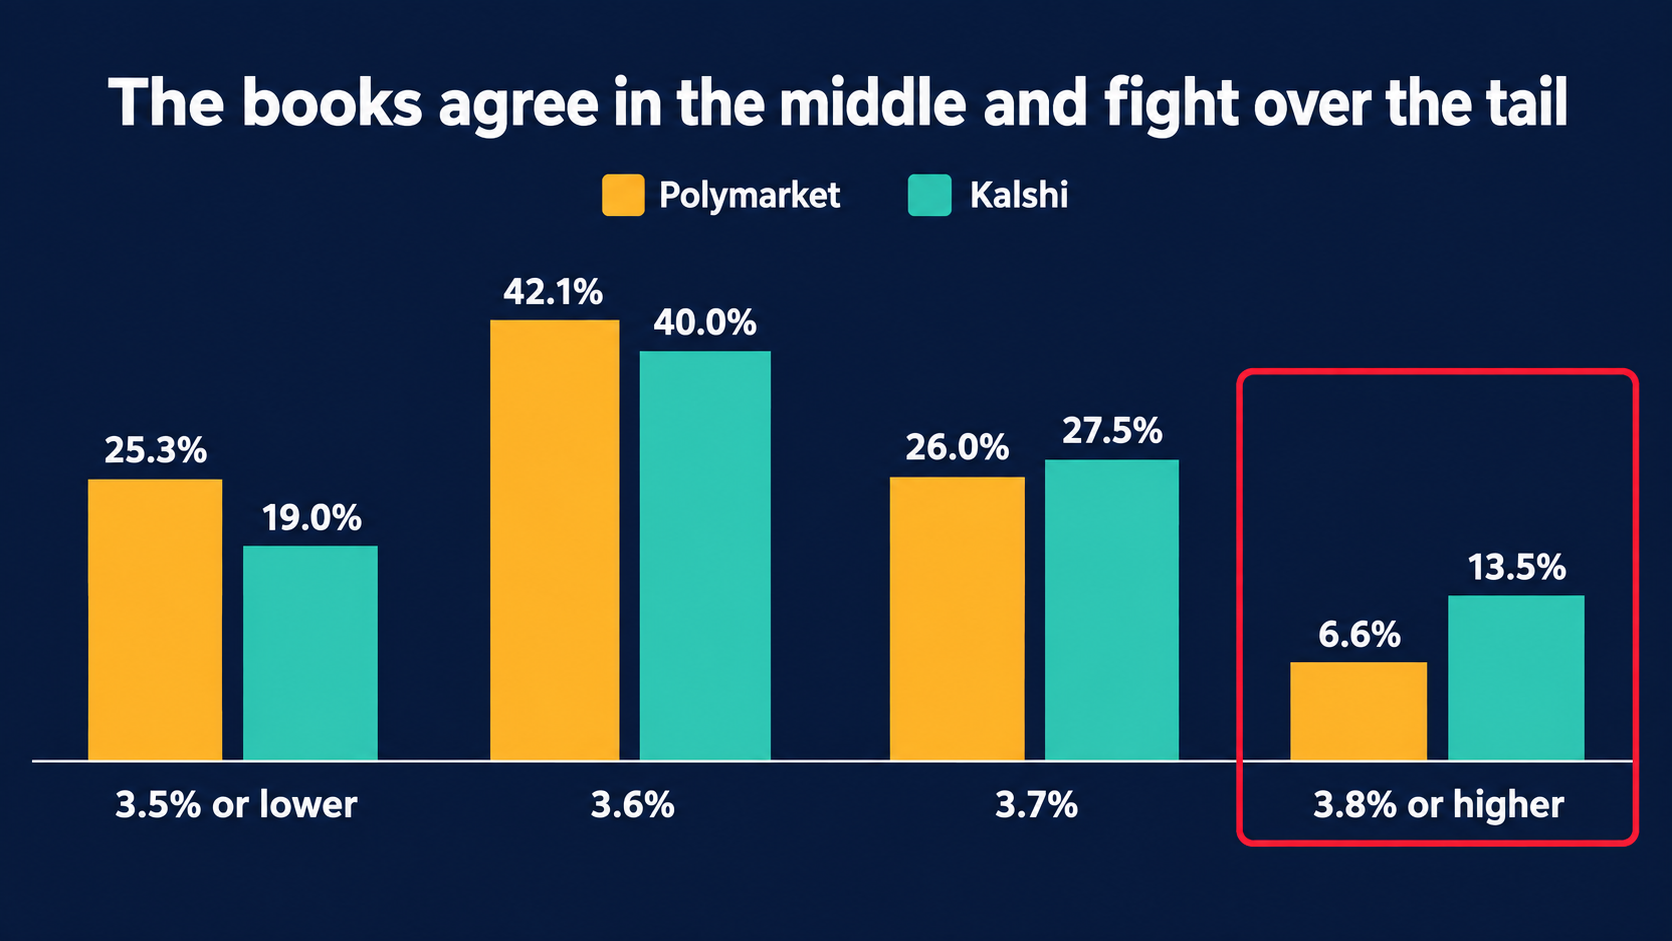
Kalshi structures the same question differently, as a cumulative ladder of "above X" contracts rather than one contract per tenth. Differencing the ladder gives a point distribution you can set directly against Polymarket's, and the two books are not saying the same thing.
| September headline outcome | Polymarket (normalised) | Kalshi (implied from ladder) | Gap |
|---|---|---|---|
| 3.5% or lower | 25.3% | 19.0% | 6.3 pts |
| 3.6% | 42.1% | 40.0% | 2.1 pts |
| 3.7% | 26.0% | 27.5% | 1.5 pts |
| 3.8% or higher | 6.6% | 13.5% | 6.9 pts |
| Open interest on the pivotal contract | n/a | 40,401 contracts |
Kalshi series KXCPIYOY-26SEP, bid/ask midpoints differenced across the ladder: above 3.5% at 81.0%, above 3.6% at 41.0%, above 3.7% at 13.5%. Captured September 22, 2026, 21:20 UTC alongside the Polymarket column.
The middle two buckets agree within two points, which is normal. The tails do not. Kalshi prices a 3.8% or higher print at roughly twice Polymarket's number, and correspondingly gives less weight to anything at or below 3.5%. On a contract where 40,401 units of open interest sit on the pivotal strike, that is not a thin-book artefact on the Kalshi side.
I lean towards Kalshi here, and the reason is in the next two sections. A fat right tail is what you would expect if the energy shock running through September has not been fully absorbed into anyone's model, and the Kalshi ladder is the only book of the three that carries a meaningful probability of a genuine upside surprise.
The Index Arithmetic Behind a 3.6% Print
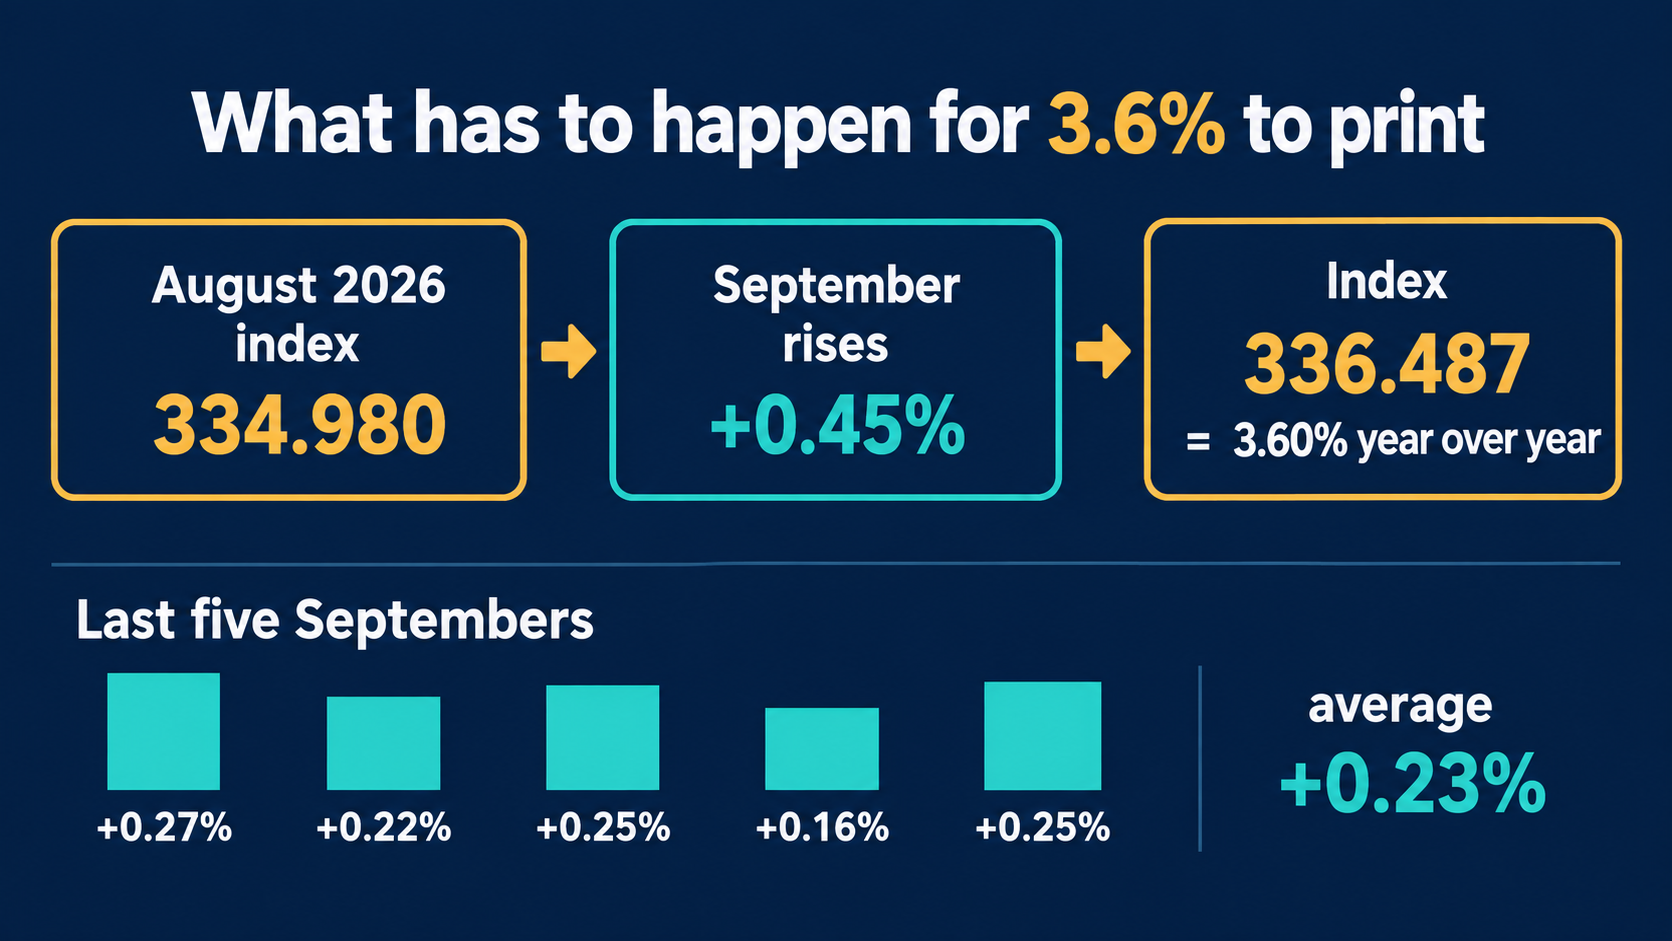
Year over year CPI is not a forecast of inflation so much as a piece of arithmetic between two index values, and you can check the market's work directly. The unadjusted headline index was 334.980 in August 2026 and 324.800 in September 2025. Everything follows from what September 2026 does to that first number.
| September unadjusted month on month | Resulting index | Implied year over year | Rounded print | Market probability |
|---|---|---|---|---|
| +0.10% | 335.315 | 3.24% | 3.2% | 0.2% |
| +0.20% | 335.650 | 3.34% | 3.3% | 0.2% |
| +0.25% (September 2025 actual) | 335.817 | 3.39% | 3.4% | 4.9% |
| +0.35% | 336.152 | 3.50% | 3.5% | 19.4% |
| +0.45% | 336.487 | 3.60% | 3.6% | 42.1% |
| +0.55% | 336.822 | 3.70% | 3.7% | 26.0% |
| +0.65% | 337.158 | 3.80% | 3.8% | 3.7% |
Author's calculation from the unadjusted CPI index (CPIAUCNS via FRED): August 2026 = 334.980, September 2025 = 324.800. The market probability column is the normalised Polymarket bucket each rounded print falls into. The 3.6% bucket spans a monthly change of +0.41% to +0.50%.
That middle row is the one to sit with. For the market's modal 3.6% to print, the unadjusted index has to rise between 0.41% and 0.50% in a single month. The last five Septembers came in at +0.27%, +0.22%, +0.25%, +0.16% and +0.25%, an average of +0.23% and never once above +0.28%. The market is asking for roughly double a normal September, and it is asking with 42% confidence.
This is where the Cleveland Fed's nowcast comes in. Its model, updated September 22, puts headline CPI at 3.50% year over year and 0.43% month on month on a seasonally adjusted basis. Round 3.50% and you get 3.5%, one tenth below where the market's money is, and the market gives that outcome only 19.4%.
So the market is a tenth hotter than the best-known public model, and Kalshi is hotter still. When three sources line up in a row like that, the interesting question is what they all know about the same thing.
Gasoline Is Doing Almost All of This
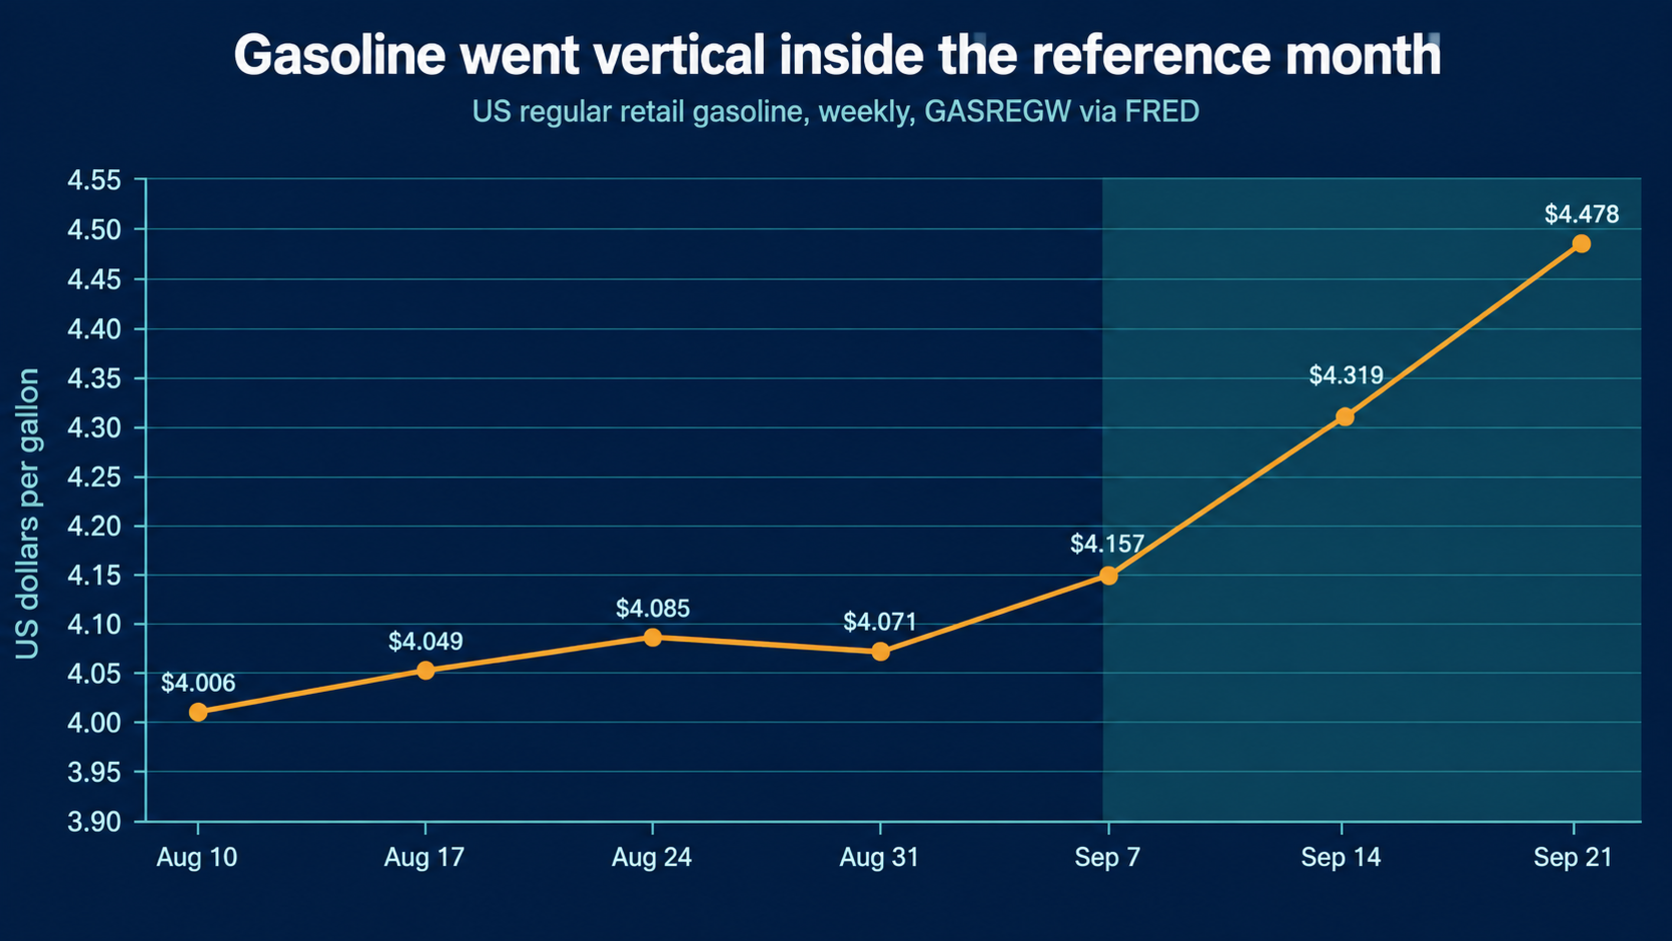
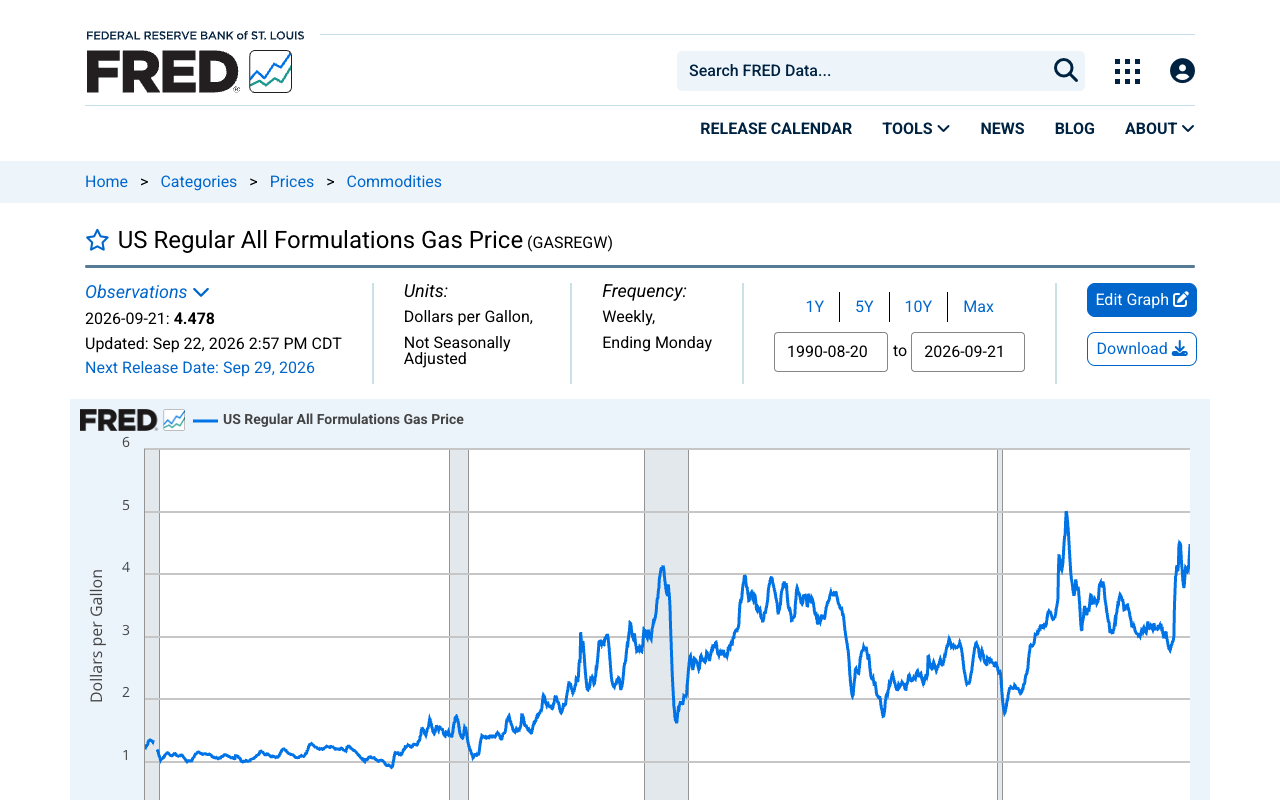
They know about the pump. US regular retail gasoline has gone almost vertical since the end of August, and it did so inside the reference month the October 14 report will measure.
| Week ending | US regular retail gasoline | Change on prior week |
|---|---|---|
| August 10, 2026 | $4.006 | -1.8% |
| August 17, 2026 | $4.049 | +1.1% |
| August 24, 2026 | $4.085 | +0.9% |
| August 31, 2026 | $4.071 | -0.3% |
| September 7, 2026 | $4.157 | +2.1% |
| September 14, 2026 | $4.319 | +3.9% |
| September 21, 2026 | $4.478 | +3.7% |
| September average so far | $4.318 | +6.4% on August |
US regular all formulations retail gasoline price, weekly (GASREGW via FRED), captured September 22, 2026. The August monthly average across five weekly observations is $4.058. West Texas Intermediate moved from $87.03 on August 31 to $107.02 on September 15.
Three weeks of September average $4.318 against an August average of $4.058, which is +6.4% month on month. If the final week simply holds at $4.478 the monthly average finishes near $4.358 and the move is +7.4%. Gasoline carries a relative importance of roughly 3% in the CPI basket, so that alone contributes between +0.19 and +0.22 percentage points to the unadjusted headline month-on-month figure.
Now put that next to the arithmetic above. The market needs about +0.45% on the unadjusted index. Core is running at about +0.2%. Gasoline supplies roughly +0.21% of the difference on its own, and the sum lands within a rounding error of what the market is pricing. The 3.6% consensus is not a call on inflation. It is a call on the pump.
That also explains the Polymarket and Kalshi disagreement cleanly. Gasoline was still climbing 3.7% week on week when these prices were captured, and the last week of the reference month was not yet in the data. Kalshi's fatter right tail is a bet that it keeps going.
Core CPI Is Where Everyone Agrees
Strip energy and food out and the argument disappears entirely. Polymarket runs two separate core books, one on the annual rate and one on the monthly change, and Kalshi runs a third. All three tell the same story, and so does the Cleveland Fed.
| Core CPI outcome | Polymarket (normalised) | Kalshi (implied) | Cleveland Fed nowcast |
|---|---|---|---|
| Year over year, 2.3% | 15.6% | n/a | |
| Year over year, 2.4% | 42.1% | n/a | 2.39%, rounds to 2.4% |
| Year over year, 2.5% | 31.7% | n/a | |
| Year over year, 2.6% | 9.5% | n/a | |
| Month on month, 0.1% | 11.7% | 10.5% | |
| Month on month, 0.2% | 48.2% | 47.0% | 0.20% |
| Month on month, 0.3% | 34.0% | 35.0% | |
| Month on month, 0.4% or more | 6.2% | 7.5% |
Polymarket events "Core CPI YoY - September 2026" and "Core CPI MoM - September 2026", normalised; Kalshi series KXCPICORE-26SEP differenced from its cumulative ladder. Cleveland Fed nowcast as of September 22, 2026. All captured September 22, 2026, 21:20 UTC.
Look at the month-on-month rows. Polymarket and Kalshi are within 1.2 points of each other at every bucket, and the Cleveland Fed's 0.20% sits exactly on the modal outcome. On core, there is nothing to argue about. That is a genuinely unusual degree of agreement for a print three weeks away.
The two Polymarket core books are also internally consistent, which is a useful sanity check on a thin market. Core rose 0.29% month on month in August against 0.22% in September 2025, so a 0.2% September keeps the annual rate near 2.43% and a 0.3% September lifts it to about 2.53%. Those map onto the 2.4% and 2.5% buckets the annual book is pricing at 42.1% and 31.7%.
If you are wondering why the committee cares about this split rather than the headline, the difference between CPI and PCE is the other half of the answer, and it is the reason a hot gasoline print is easier for the Fed to ignore than it looks.
What Each CPI Outcome Does to the October Fed Odds
This is the part that actually pays. The October 14 print is the last CPI report before the October 27 to 28 decision, and the Fed contract has already been moving without it.
| Meeting | 25 bps hike | No change | Any cut | Volume |
|---|---|---|---|---|
| October 27-28 | 52.2% | 46.2% | 0.7% | $10.1m |
| December 8-9 | 68.7% | 28.0% | 1.5% | $1.2m |
| January 26-27 | 31.7% | 56.9% | 8.8% | $0.1m |
| October, as of September 18 | 56.4% | 42.7% | 1.0% | $7.3m |
Polymarket "Fed Decision" events, normalised, captured September 22, 2026, 21:20 UTC. The bottom row is the same October book as quoted in our September 18 preview. Kalshi's October hike contract sits at a 51.5% midpoint, within a point of Polymarket.
October has cooled 3.4 points since the September 18 repricing, while December has firmed slightly. The market is edging back towards the view that the committee waits for its own projections round. A hot core print is the single thing most likely to reverse that.
My read on the mapping, and I want to be clear this is judgement rather than a quoted price: a 0.3% core month is worth perhaps 15 points to the October contract, because it would be the second consecutive firm core reading and it would arrive with the committee already split on timing. A 0.1% core takes October well below 40%. A 0.2% core, the modal outcome, changes very little.
The headline number matters far less than its size suggests. A 3.8% headline driven visibly by gasoline is a supply shock, and the committee spent most of this year saying it does not tighten into those. You can follow both contracts side by side on the live Fed decision odds page.

The Jobs Report on October 2 Lands First
Before any of that, the September employment situation arrives on October 2, and the market has a view on it too. August delivered 162,000 payrolls against a consensus near 53,000, so the bar for a repeat is high.
| September labour market outcome | Normalised probability | August actual |
|---|---|---|
| Unemployment 4.0% or lower | 26.3% | 4.1% |
| Unemployment 4.1% | 35.0% | |
| Unemployment 4.2% | 28.4% | |
| Unemployment 4.3% or higher | 10.3% | |
| Payrolls below zero | 14.0% | +162,000 |
| Payrolls 0 to 100k | 43.5% | |
| Payrolls 100k to 200k | 38.1% | |
| Payrolls above 200k | 4.4% |
Polymarket events "September Unemployment Rate" and "How many jobs added in September?", normalised, captured September 22, 2026, 21:20 UTC. August payrolls and unemployment from the establishment and household surveys via FRED.
The payroll book is the more interesting of the two. It puts 43.5% on a print between zero and 100,000 and another 14.0% on outright job losses, which together is a majority on a month that would be a clear deceleration from August. The unemployment ladder is more balanced, with a 38.7% chance of a tick up to 4.2% or worse.
A soft jobs report followed by a hot CPI print is the genuinely awkward combination, and it is not a remote scenario on these numbers. Both releases and everything else that moves these contracts sit on our macro calendar.
The October 2025 Print That Never Existed
There is a hole in the CPI series that is worth knowing about before you read any year-over-year comparison, and it becomes relevant again in eight days. Pull the CPI index from FRED and there is no October 2025 observation at all. Not a revision, not a gap in the chart. The number does not exist.
The 2025 government shutdown stopped the Bureau of Labor Statistics collecting prices, and much of that collection cannot be done retroactively: it depends on personal visits and phone calls made during the month itself. The October 2025 release was cancelled outright, breaking a monthly series that had been published continuously since January 1921.
| Funding contract | Venue | Probability of a lapse | Volume |
|---|---|---|---|
| Government shutdown by October 1 | Polymarket | 1.6% | $16,143 |
| Federal appropriations lapse on October 1 | Polymarket | 2.1% | $3,191 |
Polymarket events captured September 22, 2026, 21:20 UTC. Both resolve on whether a lapse in appropriations occurs at the start of the 2027 fiscal year. Both books are small, and a 1.6% to 2.1% range is close enough to agreement.
The market is as relaxed about the September 30 deadline as it gets, at under one chance in forty. I would not fully discount it at that level given the year Congress has had, but there is no serious case for it either, and the two independent books agree. If it did happen, the October 2 jobs report and quite possibly the October 14 CPI print would not publish, and the committee would go into its October meeting with nothing new at all.
That is the tail risk almost nobody is pricing, and it is the one that would make every number in this article moot. We track how these contracts actually resolve on our accuracy scorecard rather than asking you to take the framing on trust.
What Could Break the 3.6% Consensus
Between now and October 14 there is not much scheduled data that changes this, because the reference month is nearly over. What is left is mostly about whether the energy move continues and how the seasonal adjustment lands.
- The last week of September at the pump. One more 3.7% weekly move takes the monthly gasoline average above +8% and pushes the headline towards 3.7%. A flat week pulls it back towards the Cleveland Fed's 3.5%. This single variable is most of the distribution.
- Crude at $107. West Texas Intermediate rose 23% between August 31 and September 15. Retail prices follow crude with a two to three week lag, so most of that move is still feeding through and will land in October's reference month rather than September's.
- Shelter. It eased to 3.0% in August from 3.2% and is the single biggest line in the core index. A tenth either way on shelter matters more to the core print than anything energy does, and it is the least predictable line in the report.
- Seasonal adjustment. The headline year-over-year figure the contracts resolve on is unadjusted, but core month on month is adjusted, and September factors have been revised twice this year. This is the most common reason a well-modelled print still surprises by a tenth.
- The funding deadline on September 30. Priced at under 2.1%, but a lapse would delay or cancel the release outright, and there is recent precedent for exactly that.
My own view, for what it is worth: I think 3.6% is right and the market is fairly priced on the headline, which is not something I say often. Kalshi's 13.5% on 3.8% or higher looks slightly rich even allowing for the gasoline momentum, because it needs both a continued pump move and an upside surprise in shelter. On core, the 48% on 0.2% looks about as close to fair as a three-week-out contract gets.
Frequently asked questions
What is the CPI prediction for September 2026?
As of September 22, 2026, Polymarket prices September headline CPI at 3.6% year over year with a 42.1% normalised probability, against 26.0% for 3.7% and 19.4% for 3.5%. Kalshi's ladder implies 40.0% for 3.6%. The Cleveland Fed's nowcast is slightly cooler at 3.50%. The report is released at 08:30 Eastern on October 14, 2026.
When is the next CPI report released?
The September 2026 Consumer Price Index is released by the Bureau of Labor Statistics on Wednesday October 14, 2026 at 08:30 Eastern. Both the Polymarket and Kalshi September inflation contracts settle on the one-decimal year-over-year figure in that release.
What was CPI inflation in August 2026?
Headline CPI rose 3.4% in the twelve months to August 2026, unchanged from July, with a 0.4% seasonally adjusted monthly increase. Core CPI, which excludes food and energy, rose 0.3% on the month and slowed to 2.4% year over year, its lowest annual rate since March 2021.
Why do Polymarket and Kalshi disagree on September CPI?
They agree closely on the middle of the distribution and diverge on the upside. Kalshi's ladder implies a 13.5% chance of 3.8% or higher against Polymarket's 6.6%. The most likely explanation is the gasoline move: retail prices were still rising 3.7% week on week when these prices were captured, and Kalshi's fatter right tail is effectively a bet that the move continues through the end of the reference month.
What does September CPI mean for the October Fed decision?
October 14 is the last inflation print before the October 27 to 28 meeting. Polymarket currently gives any October hike a 53.0% chance, down from 56.4% on September 18. A 0.3% core month would firm that materially because it would be a second consecutive strong core reading, while a 0.1% core would take it well below 40%. A hot headline driven visibly by gasoline matters less, because the committee treats supply shocks differently.
Is the market expecting core inflation to rise?
No. Every source points to core holding near its current level. Polymarket puts 48.2% on a 0.2% monthly core increase and 42.1% on a 2.4% annual rate, Kalshi's core ladder implies 47.0% on the same monthly outcome, and the Cleveland Fed nowcasts 0.20% and 2.39%. The disagreement between venues is entirely in the headline, which includes energy.
Why is there no October 2025 CPI figure?
The 2025 government shutdown prevented the Bureau of Labor Statistics from collecting prices during October, and much of that collection cannot be done retroactively because it relies on in-person visits and phone calls made within the month. The October 2025 release was cancelled, leaving a permanent gap in a monthly series published continuously since January 1921.
Could a government shutdown delay the October 2026 CPI report?
It is possible but unlikely on current pricing. Polymarket's two independent contracts on a lapse in appropriations at the October 1 deadline trade at 1.6% and 2.1%. If a lapse did occur, the September jobs report on October 2 and possibly the October 14 CPI release would be delayed or cancelled, and the Federal Open Market Committee would meet with no new official data.