10-Year Treasury Yield Forecast 2026: Why 4.8% Matters

If you own a mortgage, a bond fund or anything priced off long rates, the number that actually governs your year is the 10-year Treasury yield, and it closed at 4.80% on September 8, 2026. That is the highest close of the year, above every close in 2025 and 2024, and it landed eight days before an FOMC meeting that the market treats as a coin flip on a rate hike.
The stakes are concrete. The 10-year sets the floor under 30-year mortgage pricing, corporate borrowing and the government's own interest bill on $40.09 trillion of public debt outstanding as of September 4, 2026. It started 2026 at 4.19%. Every 60 basis points on that line is real money moving out of borrowers' pockets.
I am not going to hand you a single point forecast, because nobody can honestly give you one. What I can do is show you what the curve is actually saying, and I built every number below from the Treasury's own daily par yield and real yield series rather than from a headline. That includes pulling the 2023, 2024 and 2025 files to check the "19-month high" claim doing the rounds this week, which turns out to be wrong.
Below: where the curve sits today, why the real yield rather than inflation expectations did most of the damage, what published forecasts say for end-2026 and 2027, and what prediction markets price for the September decision. For the constantly updating Fed side of this, we keep that on our Fed decision odds page.
Where the 10-Year Treasury Yield Stands Today
The level on its own tells you very little. What matters is the whole curve and how it got here, so here is the September 8 close against the first trading day of the year and against February's low.
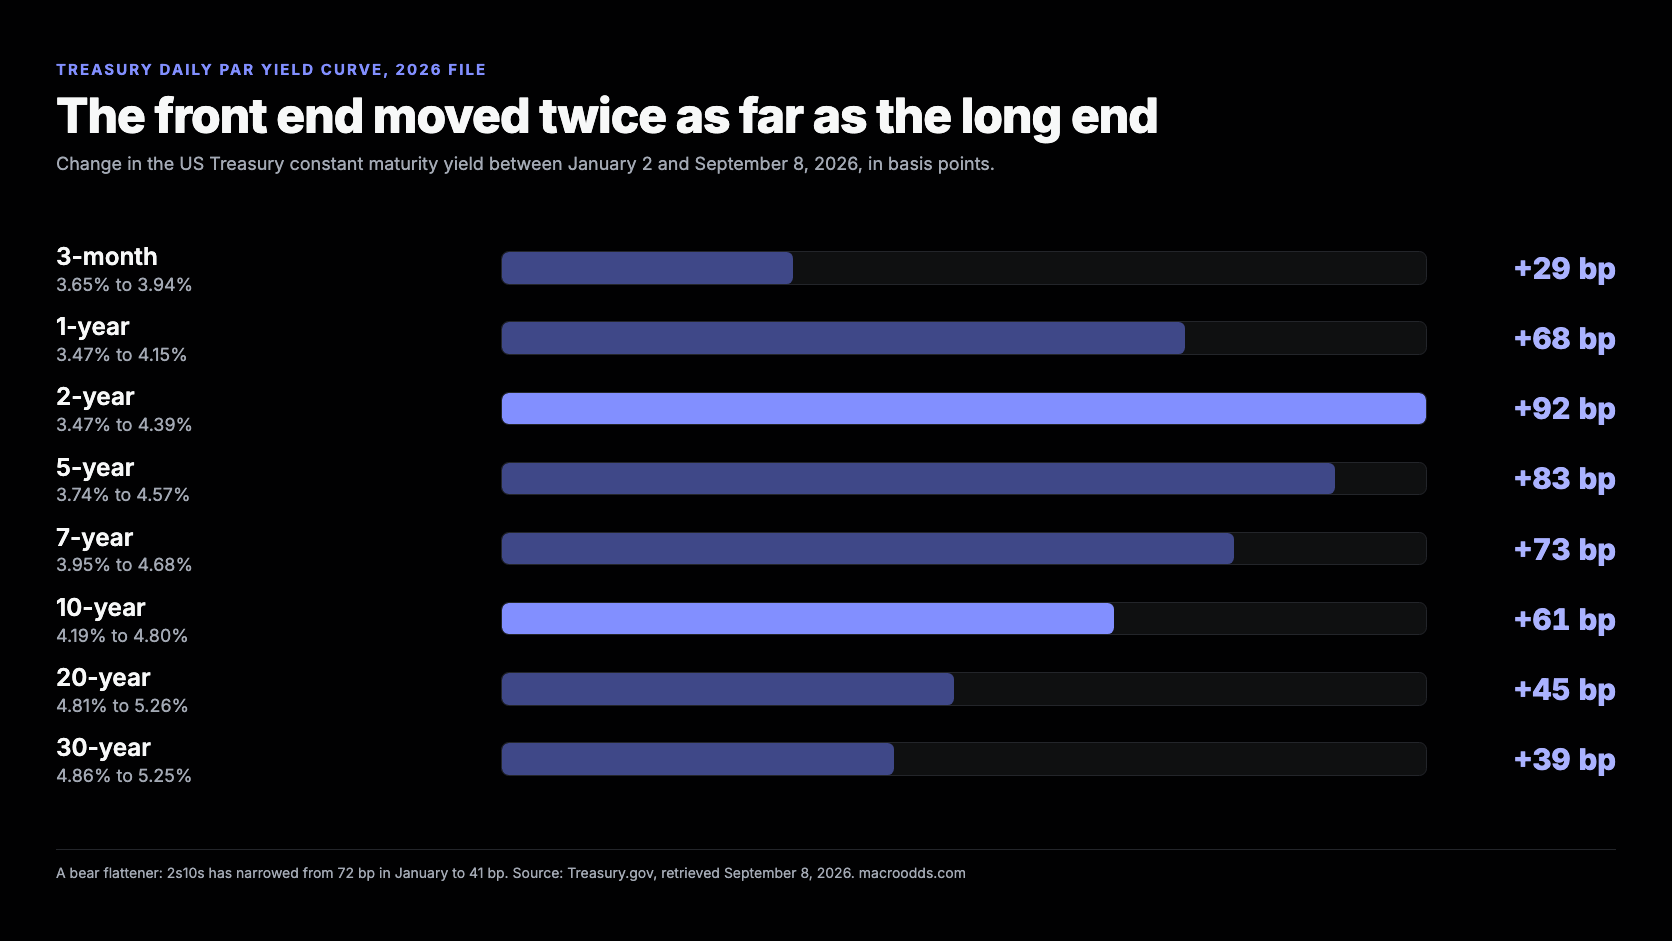
| Maturity | Sep 8, 2026 | Jan 2, 2026 | Change YTD |
|---|---|---|---|
| 3-month | 3.94% | 3.65% | +29 bp |
| 1-year | 4.15% | 3.47% | +68 bp |
| 2-year | 4.39% | 3.47% | +92 bp |
| 5-year | 4.57% | 3.74% | +83 bp |
| 7-year | 4.68% | 3.95% | +73 bp |
| 10-year | 4.80% | 4.19% | +61 bp |
| 20-year | 5.26% | 4.81% | +45 bp |
| 30-year | 5.25% | 4.86% | +39 bp |
US Treasury daily par yield curve rates, constant maturity. Source: Treasury.gov Daily Treasury Par Yield Curve Rates, 2026 file, retrieved September 8, 2026.
Read the change column from the top and the shape jumps out. The front end is up hard, the long end much less so. That is a market repricing policy, not a market panicking about the next thirty years. I come back to why that distinction matters in a moment.
4.80% Is Not a 19-Month High. It Is a Three-Year High
Plenty of coverage this week has called 4.80% the highest since January 2025. I downloaded the Treasury's 2023, 2024 and 2025 daily files to check, and that framing understates it. The 2025 peak was 4.79%, one basis point below where we are now, so the January 2025 high has been taken out rather than matched.
| Year | Highest 10-year close | Date | Closes at or above 4.80% |
|---|---|---|---|
| 2026 (to Sep 8) | 4.80% | September 8, 2026 | 1 |
| 2025 | 4.79% | January 13, 2025 | 0 |
| 2024 | 4.70% | April 25, 2024 | 0 |
| 2023 | 4.98% | October 19, 2023 | 12 |
Computed from the Treasury.gov daily par yield curve files for each year. The last close at or above 4.80% before this week was October 31, 2023, at 4.88%.
I am not claiming the reporters got sloppy for no reason. Intraday prints and different data vendors do not always agree with the Treasury's official constant maturity close, and a 1 bp gap is exactly the kind of thing that gets rounded away. But the official series is the one the mortgage market and the Treasury's own interest calculations run on, so it is the one I use.
The Real Yield Did 80% of the Work, Not Inflation Fear
This is the part almost nobody breaks out, and it changes the story completely. A nominal Treasury yield is roughly the real (inflation-protected) yield plus the market's expected inflation over the same horizon. Treasury publishes the real curve daily from TIPS, so you can split the move rather than guess at it.
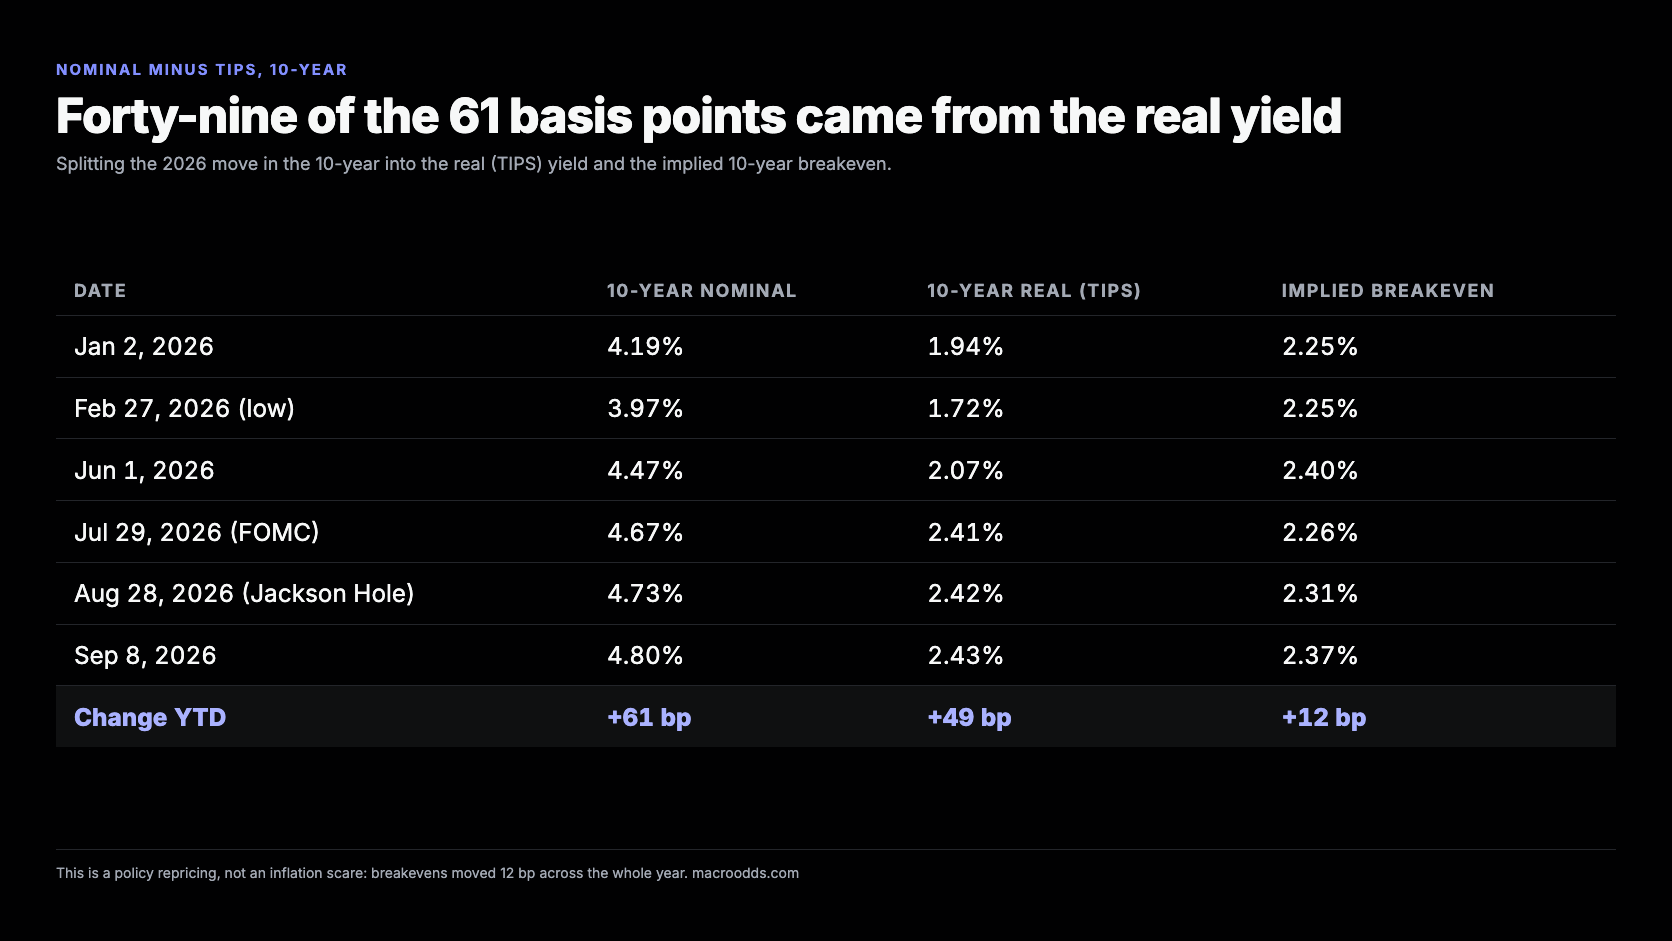
| Date | 10-year nominal | 10-year real (TIPS) | Implied breakeven |
|---|---|---|---|
| Jan 2, 2026 | 4.19% | 1.94% | 2.25% |
| Feb 27, 2026 (low) | 3.97% | 1.72% | 2.25% |
| Jun 1, 2026 | 4.47% | 2.07% | 2.40% |
| Jul 29, 2026 (FOMC) | 4.67% | 2.41% | 2.26% |
| Aug 28, 2026 (Jackson Hole) | 4.73% | 2.42% | 2.31% |
| Sep 8, 2026 | 4.80% | 2.43% | 2.37% |
| Change YTD | +61 bp | +49 bp | +12 bp |
Nominal from the Treasury daily par yield curve, real from the Treasury daily real (TIPS) yield curve, both 2026 files retrieved September 8, 2026. Breakeven is nominal minus real, the standard approximation.
Forty-nine of the 61 basis points came from the real yield. Only 12 came from expected inflation. The 10-year breakeven has moved from 2.25% to 2.37% across a year in which headline inflation ran well above target and gasoline spiked. That is a bond market that believes the Fed will do whatever it takes, and is charging more for the doing.
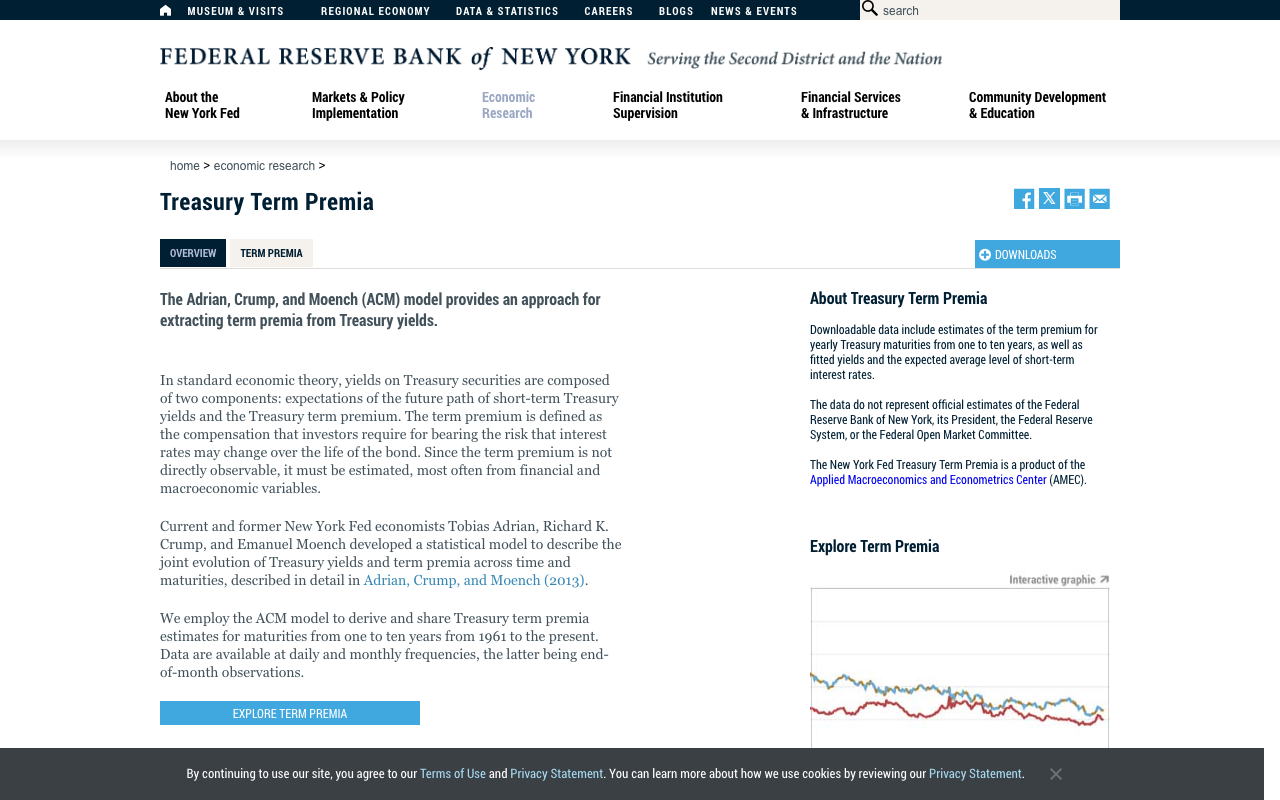
So when you read that yields are rising "on inflation fears", treat it as shorthand that is four-fifths wrong. The market is not pricing an inflation spiral. It is pricing tighter policy for longer, plus more compensation for holding duration at all. The New York Fed's term premium estimates have been back in clearly positive territory through 2026 after roughly five years near or below zero, though published vintages of that model have ranged from about 0.5 to 0.9 percentage points this year, so I would not lean on a single decimal.
That distinction is also why the inflation prints still matter for the path even though they have not driven the level. If August CPI on September 11 comes in soft, it does not lower breakevens much, because breakevens never went up much. It changes the odds on policy, which is the part carrying the yield. We track the market's pricing of that print on the CPI inflation prediction page.
What the Curve Shape Says That the Level Does Not
The last time the 10-year closed here, on October 31, 2023, the curve looked nothing like today's. This comparison is the single most useful thing in this article if you are trying to work out whether 4.80% is a buying opportunity or a warning.
| Measure | Oct 31, 2023 | Sep 8, 2026 | What changed |
|---|---|---|---|
| 10-year | 4.88% | 4.80% | Roughly the same level |
| 2-year | 5.07% | 4.39% | 68 bp lower now |
| 30-year | 5.04% | 5.25% | 21 bp higher now |
| 2s10s spread | -19 bp (inverted) | +41 bp (positive) | 60 bp of re-steepening |
| Fed policy direction | End of a hiking cycle | Possible restart of hiking | Opposite ends of the cycle |
Treasury.gov daily par yield curve, 2023 and 2026 files. The 2s10s spread is the 10-year minus the 2-year.
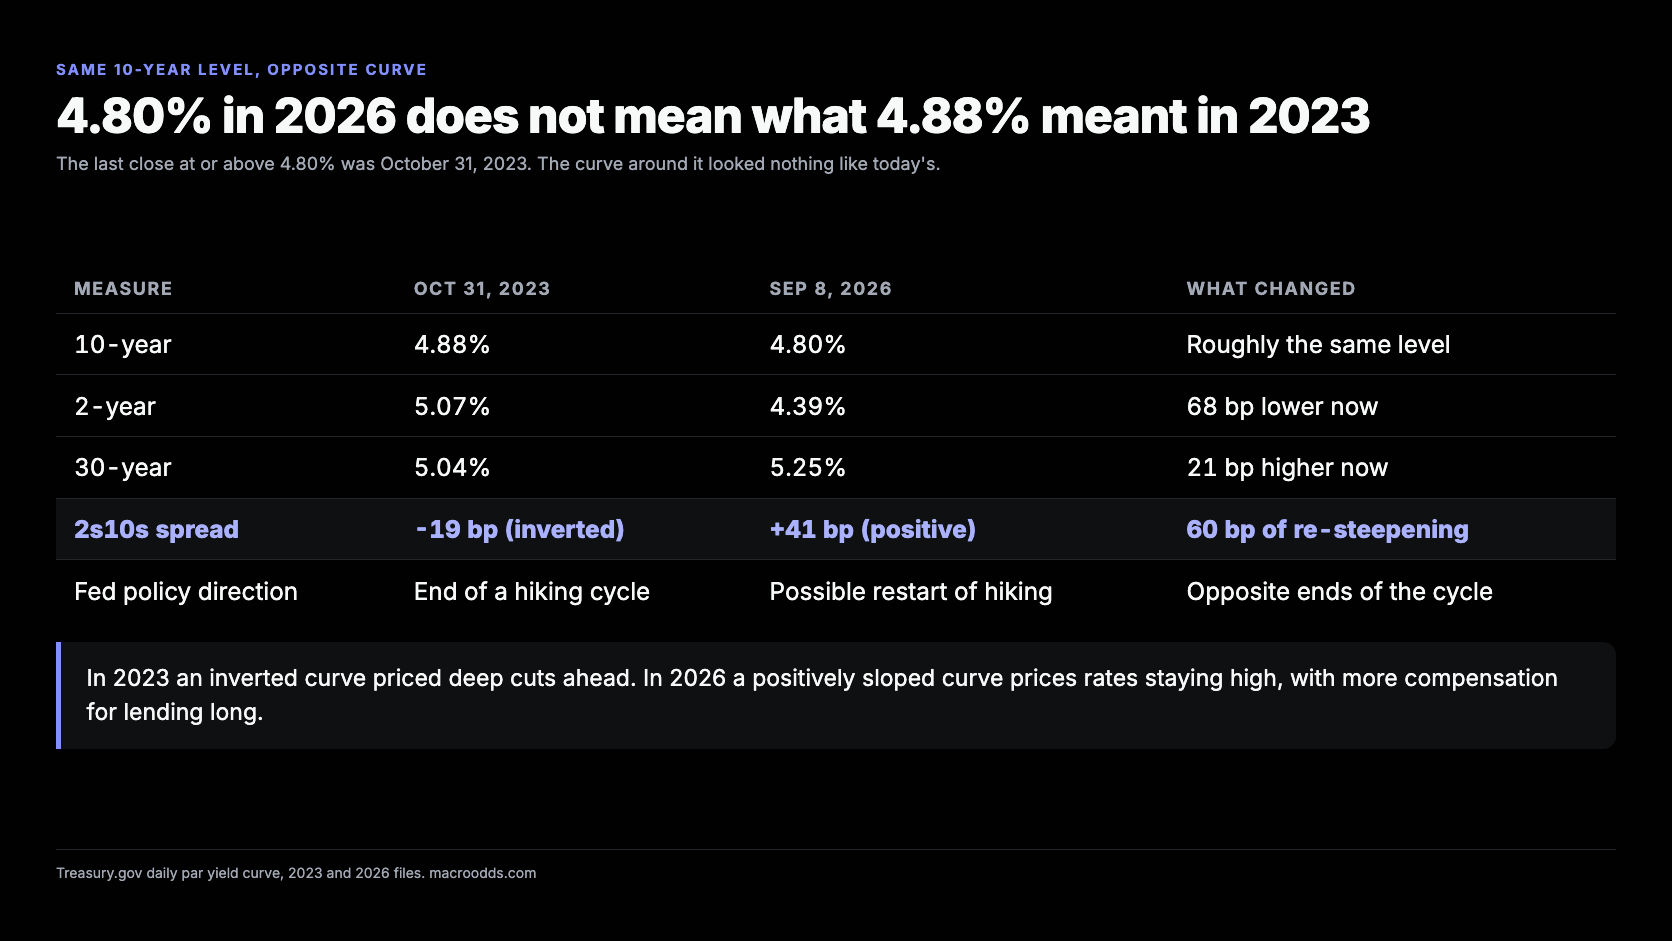
In late 2023 an inverted curve was telling you the market expected the Fed to be cutting hard within a year or two, and the long end was capped by that expectation. Today the curve is positively sloped with the 30-year above the 10-year and both above the 2-year. That is a market saying rates stay high and the compensation for lending long has to rise.
The re-steepening from inversion is itself worth understanding, because the inverted curve is the recession signal people quote and it has now unwound. We wrote up what that signal does and does not tell you in what is an inverted yield curve. The short version: the un-inversion is not an all clear, and it historically arrives closer to trouble than the inversion did.
10-Year Treasury Yield Forecasts for End-2026 and 2027
Here is the honest state of the published forecasts, including the ones I think are unreliable, with dates so you can see how stale each is. Any 10-year Treasury yield forecast made before Jackson Hole on August 28 is describing a different world.
| Forecaster | End-2026 | 2027 | As of | Type |
|---|---|---|---|---|
| HSBC | 4.65% | 4.75% (end-2027) | Sep 3, 2026 | Bank research |
| JPMorgan | 4.85% | not stated | Sep 2026 | Bank research |
| Trading Economics model | 4.68% (Q4 26) | 4.56% (Q2 27) | Sep 2026 | Econometric model |
| Financial Forecast Center | 4.23% to 4.73% range | to Apr 2027 | Sep 2, 2026 | Algorithmic |
| Long Forecast | 4.96% (Dec 26) | 4.22% (Dec 27) | Sep 2026 | Algorithmic |
| Current spot | 4.80% | n/a | Sep 8, 2026 | Market |
Published forecasts as of September 8, 2026. HSBC's September 3 note raised end-2026 from 4.30% to 4.65% and its 2-year forecast from 3.85% to 4.20%. Algorithmic forecasters are included for completeness, not endorsement.
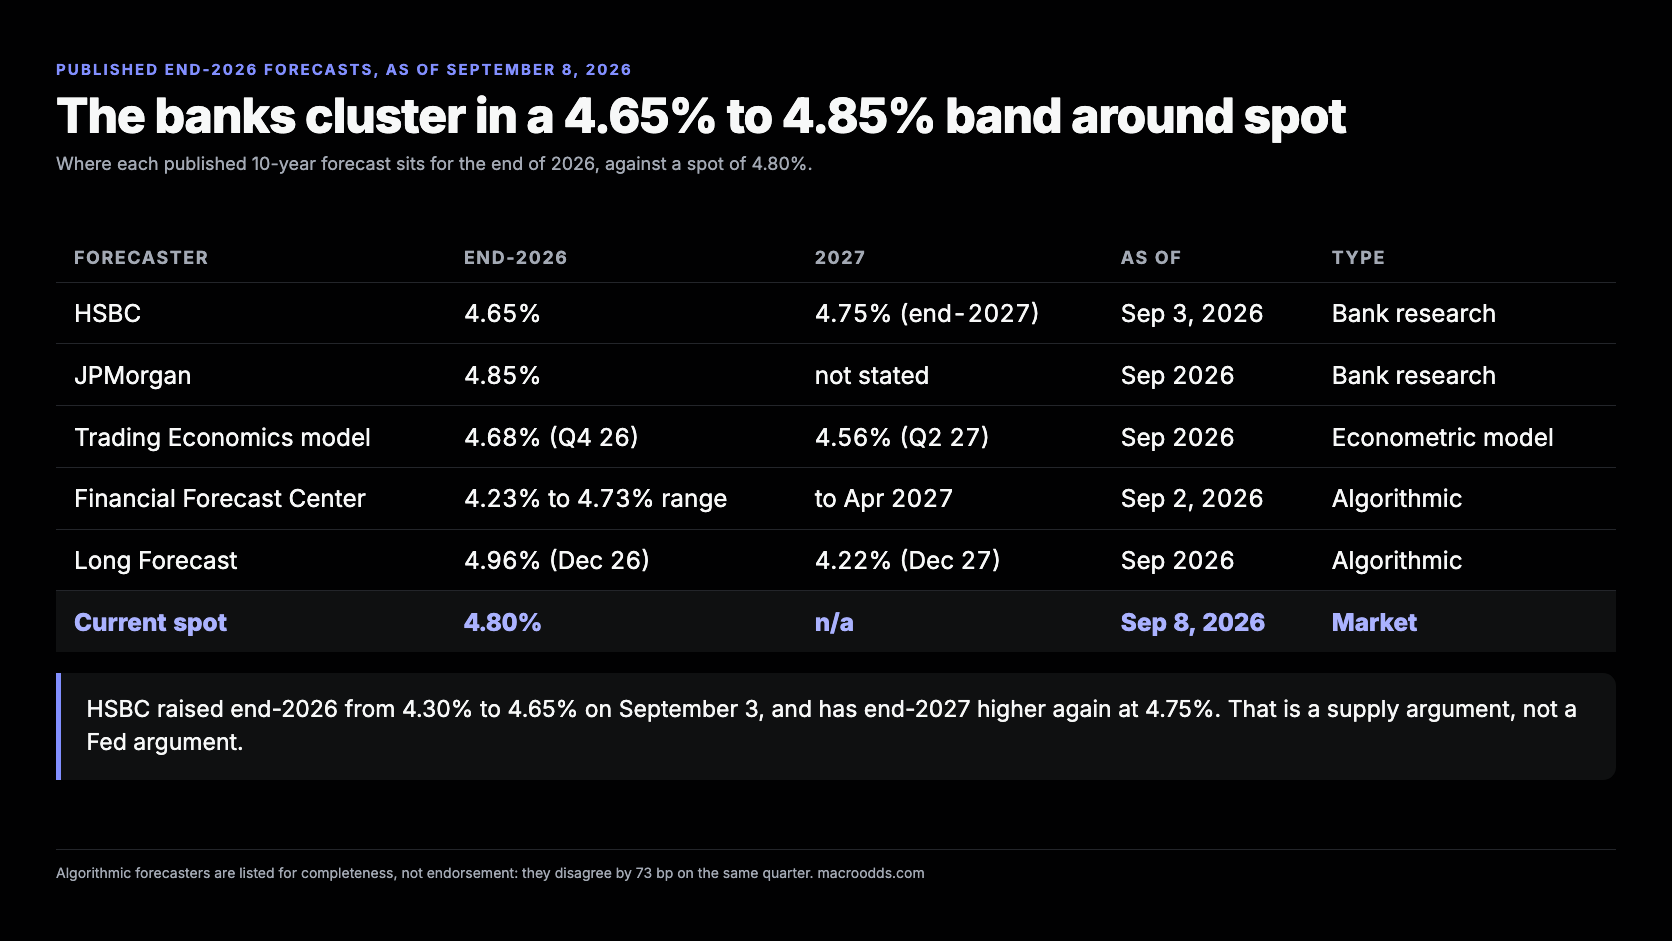
Two things to take from that table. First, the bank forecasts cluster in a 4.65% to 4.85% band for year end, which brackets today's spot almost exactly. The people paid to have a view are, in effect, saying the 10-year is roughly where it should be and the next 100 days are noise around that.
Second, look at HSBC's shape. It has end-2027 at 4.75%, *above* its end-2026 number of 4.65%. That is not a forecaster expecting relief. Its stated logic is that large fiscal deficits point to a steepening curve over time, which is a supply argument rather than a Fed argument, and supply arguments do not resolve when the Fed stops moving. The scale of that supply is the subject of our piece on the US national debt.
I would treat the algorithmic forecasters with real caution. Long Forecast has September 2026 averaging 5.04% in a month whose five trading days so far have averaged 4.79%, and Financial Forecast Center's band bottoms out at 4.23%, a level the 10-year has not seen since February. When two model outputs disagree by 70 basis points on the same quarter, neither is telling you much.
What Prediction Markets Price for the September Fed Decision
The 10-year is a long-horizon instrument, but the next eight days are dominated by one event, and prediction markets give you a cleaner read on it than a futures-implied probability does. Here is where both venues sit tonight.
| Outcome on September 16 | Polymarket | Kalshi | Kalshi volume |
|---|---|---|---|
| Hike 25 bp (to 3.75-4.00%) | 54.5% | 53% | $7.1M |
| No change (hold at 3.50-3.75%) | 45.5% | 45% | $15.5M |
| Hike more than 25 bp | 0.45% | 1% | $9.4M |
| Cut 25 bp | 0.45% | 1% | $7.0M |
| Cut more than 25 bp | 0.15% | 1% | $1.2M |
Captured September 8, 2026, 21:20 UTC. Polymarket via the Gamma API (event 'Fed Decision in September?', $104.6M total volume); Kalshi via last trade on the KXFEDDECISION-26SEP series. Kalshi's column sums above 100% because these are last trades on separate contracts, not one normalised book.
A hike is now the modal outcome on both venues, and it has firmed since the August jobs report: Polymarket was at 51.5% on September 4 and is at 54.5% tonight. Kalshi's October contract prices a hike at that specific meeting at 27%, with a hold at 68%, so the market sees September as the live one rather than the first of a series.
Here is the thing that surprised me when I lined the two datasets up. The 10-year barely moved on the jobs report itself, going from 4.77% on September 3 to 4.78% on September 4, while the hike probability jumped double digits. The 2-year did the work, adding 3 bp that day and 14 bp on Jackson Hole. The long end has already priced the policy story; the front end is still catching up. That is worth remembering if you are expecting a September 16 hike to send the 10-year sharply higher. It may not.
Our full breakdown of the decision itself, including the dissent market and the dot plot, is in Fed rate hike odds September 2026, and the live meeting page is September 2026 FOMC.
What Would Actually Move the 10-Year From Here
Four dates do most of the work between now and the end of the year. Everything else is positioning noise.
| Date | Event | Why the 10-year cares |
|---|---|---|
| Sep 10, 2026 | August PPI (BLS) | First read on whether the energy pass-through is still building |
| Sep 11, 2026 | August CPI (BLS) | Last inflation print before the decision. Moves policy odds, not breakevens |
| Sep 15-16, 2026 | FOMC decision plus SEP | Dot plot meeting. The dots can tighten policy without a hike |
| Sep 30, 2026 | August PCE (BEA) | The gauge the 2% target is actually defined on |
| Oct 27-28, 2026 | FOMC decision | No SEP. Kalshi prices a hike here at 27% |
| Dec 8-9, 2026 | FOMC decision plus SEP | Sets the 2027 dots, which is what the 10-year trades off |
Release dates from the BLS, BEA and Federal Reserve 2026 calendars, as carried on our economic calendar.
The dot plot on September 16 is the underrated one. A committee that holds rates but shifts its 2027 dots upward has tightened the part of the curve the 10-year actually reflects, without touching the policy rate at all. It is entirely possible for the hold contracts to pay out and for the 10-year to rise anyway.
The other live variable is supply, and it does not sit on a calendar. Deficit financing sets how much duration the market has to absorb, and it is the mechanism behind HSBC's steepening call. If you want to see the practical end of all this, higher long yields feed straight into mortgage pricing, which we track in will mortgage rates drop in 2026.
- Soft August CPI on September 11: hike odds fall back toward 40%, the 2-year leads a rally, the 10-year follows a fraction of the way. The curve re-steepens.
- Hot CPI: the hike goes near-certain, the 2-year jumps, 2s10s flattens further and 4.80% becomes the floor rather than the ceiling.
- Hold on September 16 with hawkish dots: the front end rallies, the belly does not, and the 10-year ends the week roughly where it started.
- Hike plus a signal that it is the last one: the classic outcome where the 10-year *falls* on a hike, because the terminal rate is what it trades off.
How to Use a 10-Year Yield Forecast Without Getting Burned
A yield forecast is a distribution, not a number, and the honest version of any of the figures in the forecast table above carries an error band of well over 50 basis points at a 12-month horizon. Point forecasts get published because a range does not fit in a headline.
So use them for direction and clustering rather than for levels. When four independent forecasters land inside a 20 bp band around spot, as they do now, the useful information is the *agreement*, not the midpoint. When they disagree by 80 bp, as the algorithmic ones do, the useful information is that the model has no view worth having.
And separate the two questions you might actually be asking. "Where will the 10-year be in December" is a forecasting question with a wide band. "What is priced in for September 16" is a market question with a precise, tradeable answer that you can read off a screen. Our economic calendar and decision tools are built around the second one, because it is the one you can be right about.
My own read, and it is only a read: the 4.65% to 4.85% band the banks have converged on looks about right, and I would be more surprised by a break below 4.50% this year than by a print at 5%. The reason is the decomposition in the third table. A move driven by real yields and term premium does not unwind on one soft inflation print, because it was never really about inflation. It unwinds when the market believes policy has peaked, and on September 8, 2026 the market does not believe that yet.
Frequently asked questions
What is the 10-year Treasury yield today?
The 10-year Treasury constant maturity yield closed at 4.80% on September 8, 2026, according to the Treasury's daily par yield curve. That is the highest close of 2026 and the highest since October 31, 2023. It started the year at 4.19% and bottomed at 3.97% on February 27.
What is the 10-year Treasury yield forecast for the end of 2026?
Published bank forecasts cluster between 4.65% and 4.85%. HSBC raised its end-2026 forecast to 4.65% from 4.30% on September 3, 2026, and JPMorgan's year-end target is 4.85%. Trading Economics' model has Q4 2026 at 4.68%. All of those brackets today's spot of 4.80%, which is another way of saying the professionals do not expect a big move from here.
Why are Treasury yields rising in 2026?
Mostly because the market has repriced Fed policy, not because it fears runaway inflation. Of the 61 basis point rise in the 10-year this year, 49 bp came from the real (TIPS) yield and only 12 bp from the 10-year breakeven. Chairman Warsh's hawkish Jackson Hole address on August 28 and a strong August jobs report shifted the expected policy path upward, and term premium has returned to clearly positive territory.
Is 4.80% on the 10-year a 19-month high?
No, and this is a common error in current coverage. The highest 10-year close in 2025 was 4.79% on January 13, one basis point below today, so the January 2025 peak has been exceeded rather than matched. The last close at or above 4.80% was October 31, 2023, at 4.88%, which makes this a three-year high on the Treasury's official constant maturity series.
What does the yield curve look like now compared with 2023?
Very different, at almost the same 10-year level. On October 31, 2023 the 2s10s spread was inverted at minus 19 basis points with the 2-year at 5.07%. On September 8, 2026 it is positive at plus 41 basis points with the 2-year at 4.39%. In 2023 the market expected deep cuts; in 2026 it is pricing a possible restart of hiking plus higher compensation for holding duration.
Will the Fed raise rates in September 2026, and what would that do to the 10-year?
Polymarket prices a 25 basis point hike on September 16 at 54.5% and Kalshi at 53%, so it is close to a coin flip. A hike would not automatically push the 10-year higher. The 10-year barely moved on the August jobs report even as hike odds jumped, which suggests the long end has already priced the policy story and the front end is the part still adjusting.
How does the 10-year Treasury yield affect mortgage rates?
The 30-year mortgage rate is priced at a spread over the 10-year Treasury, so the 10-year is the single biggest input into what a homebuyer pays. A 61 basis point rise in the 10-year since January feeds through to mortgage quotes with a lag and a variable spread, which is why mortgage forecasts for the rest of 2026 have been revised upward alongside the Treasury forecasts.
What is the difference between the nominal and real 10-year Treasury yield?
The nominal yield, 4.80% on September 8, is what a conventional Treasury note pays. The real yield, 2.43% on the same day, is what an inflation-protected TIPS of the same maturity pays after inflation. The gap between them, 2.37%, is the 10-year breakeven, which is the market's implied average inflation rate over the next decade. Splitting the two tells you whether a yield move is about policy or about inflation.
Sources
- Daily Treasury Par Yield Curve Rates, 2026, U.S. Department of the Treasury
- Daily Treasury Par Real Yield Curve Rates (TIPS), 2026, U.S. Department of the Treasury
- Treasury Term Premia (ACM model), Federal Reserve Bank of New York
- H.15 Selected Interest Rates, Board of Governors of the Federal Reserve System