Fed Dot Plot September 2026: What the Dots Will Show

Four times a year the Federal Reserve publishes a chart that moves more money than the rate decision it arrives with, and the next one lands at 2:00 pm ET on September 16, 2026. The Fed dot plot is the part of the Summary of Economic Projections where each participant marks where they think the federal funds rate should sit at the end of each year.
The stakes this time are unusually concrete. In June the committee's median end-2026 dot was 3.8%, or 3.75% before rounding, against a current target range of 3.50% to 3.75%. As of this evening prediction markets price an end-2026 midpoint of 4.06%. That is a 31 basis point disagreement between the people who set the rate and the people betting on it, and September 16 is when one side blinks.
I pulled the June and March projection tables off the Fed's own site rather than working from coverage of them, and the arithmetic in the third section below is the part I had not seen anyone do. It took two passes, because the first time I assumed the 3.8% median was somebody's forecast. It is not. No participant can be at 3.8%.
Below: what the dot plot actually is and how Warsh has changed it, what June's numbers said, how far they moved from March, what Polymarket and Kalshi price tonight, the gap between the two, and how to read the September chart in the first ninety seconds. The live pricing sits on our Fed decision odds page.
What the Fed Dot Plot Is, and What Warsh Changed
The dot plot is one exhibit inside the Summary of Economic Projections, published four times a year after the March, June, September and December meetings. Each FOMC participant, voting or not, marks the midpoint of the target range they think appropriate at the end of each calendar year and in the longer run. The dots are anonymous and they are not a committee forecast. They are nineteen individual opinions printed on the same axis.
| Element | What it contains | Released |
|---|---|---|
| Policy statement | The decision and the vote | 2:00 pm ET, every meeting |
| Summary of Economic Projections | GDP, unemployment, PCE, core PCE, fed funds | Mar, Jun, Sep, Dec only |
| Dot plot (SEP figure 2) | One dot per participant per year | Mar, Jun, Sep, Dec only |
| Press conference | The chair's interpretation of all of it | 2:30 pm ET |
| Minutes | The argument behind the vote | Three weeks later |
The September 15-16, 2026 meeting is a projection meeting. October 27-28 is not. Source: Federal Reserve FOMC calendars, retrieved September 11, 2026.
That schedule matters for how you read the year. There are only two projection rounds left in 2026, September and December, so the September chart carries most of the remaining information about where this committee thinks it is going.
I think the abstention is the single most underrated fact about reading this chart in 2026, and I come back to why in a moment. First, the numbers.
The June 2026 Dot Plot: A Committee Split Exactly Down the Middle
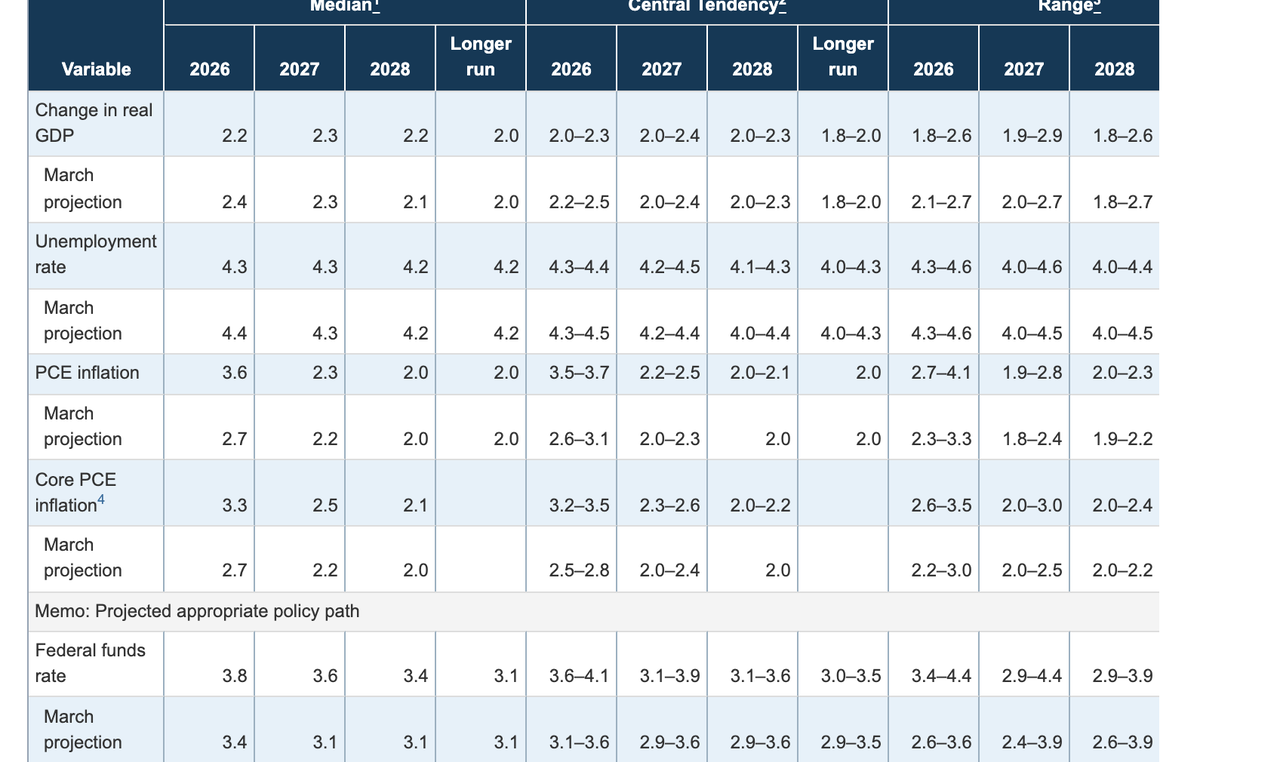
Here is the June 17, 2026 projection table in full, because most coverage quotes the rate line and drops the rest, and the rest is where the argument lives.
| Variable (median) | 2026 | 2027 | 2028 | Longer run |
|---|---|---|---|---|
| Federal funds rate | 3.8% | 3.6% | 3.4% | 3.1% |
| Fed funds central tendency | 3.6-4.1% | 3.1-3.9% | 3.1-3.6% | 3.0-3.5% |
| Fed funds full range | 3.4-4.4% | 2.9-4.4% | 2.9-3.9% | 2.9-3.9% |
| PCE inflation | 3.6% | 2.3% | 2.0% | 2.0% |
| Core PCE inflation | 3.3% | 2.5% | 2.1% | n/a |
| Unemployment rate | 4.3% | 4.3% | 4.2% | 4.2% |
| Change in real GDP | 2.2% | 2.3% | 2.2% | 2.0% |
Summary of Economic Projections, June 17, 2026, Federal Reserve Board. Eighteen participants submitted federal funds projections.
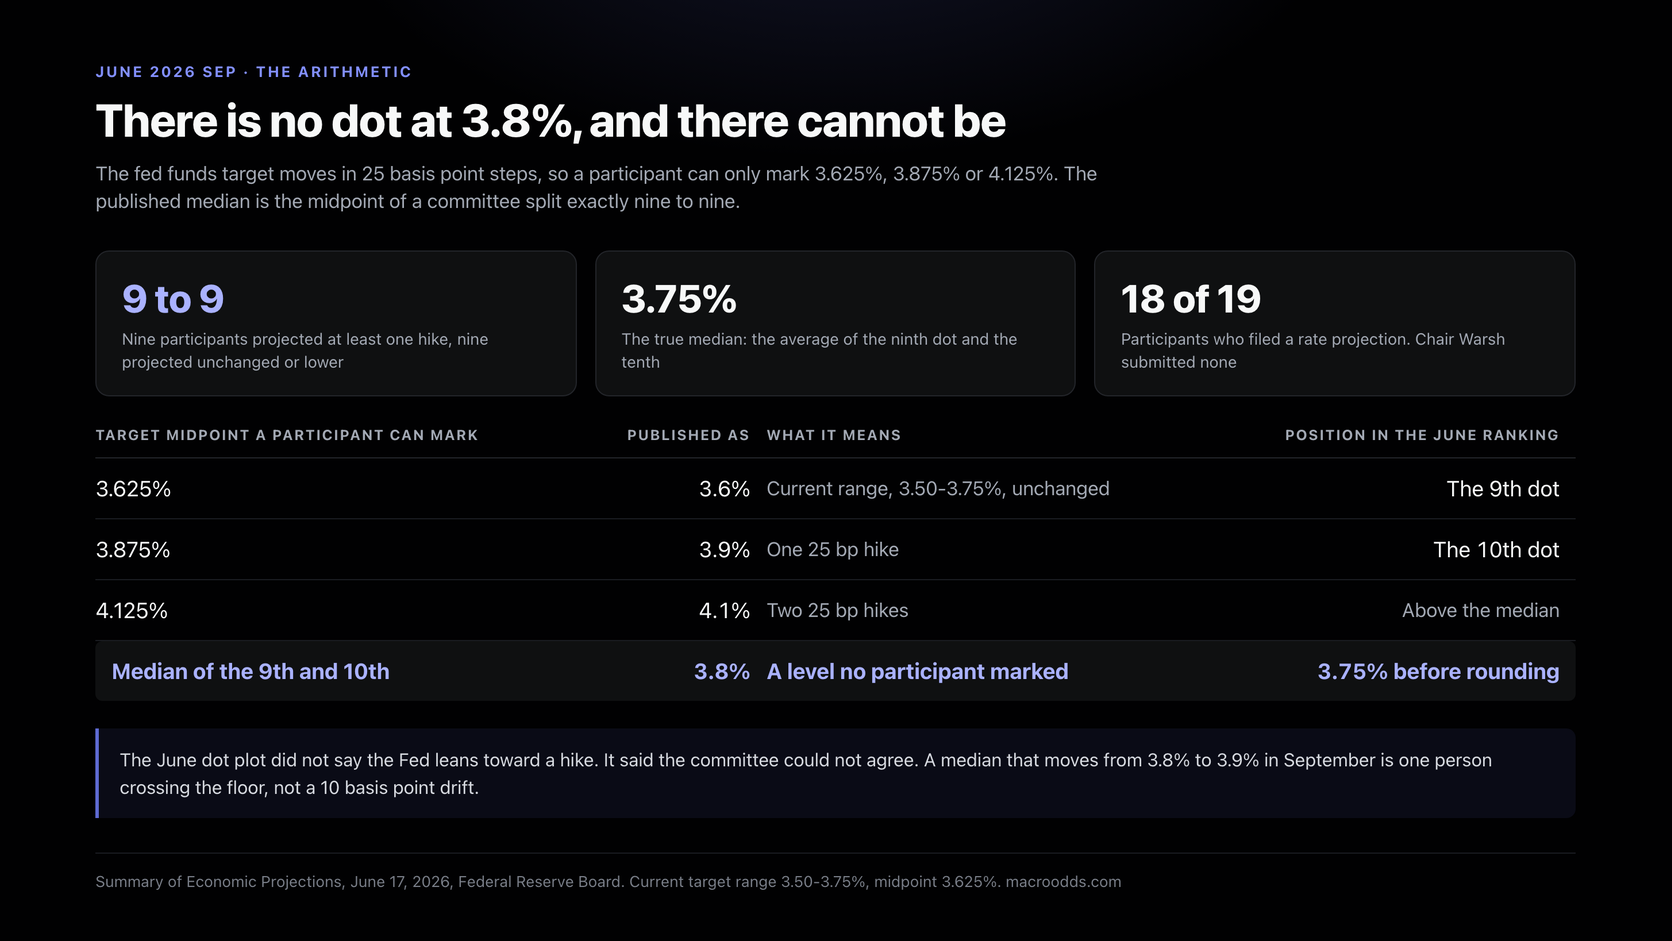
Now the part that took me a second pass. The fed funds target moves in 25 basis point steps, so the midpoints a participant can actually mark are 3.625% for the current range, 3.875% for one hike, 4.125% for two. The SEP rounds those to 3.6%, 3.9% and 4.1%. There is no dot at 3.8%. There cannot be.
With eighteen dots the median is the average of the ninth and tenth. Nine participants projected at least one hike, six of those projecting more than one, and nine projected unchanged or lower. So the ninth dot sat at 3.625% and the tenth at 3.875%, and the published median is the midpoint of a stalemate. The June dot plot did not say the Fed leans toward a hike. It said the committee could not agree.
That reframing changes what September means. A median that moves from 3.8% to 3.9% is not a modest 10 basis point drift. It is one person crossing the floor and the tie breaking in public.
How Far the Dots Moved From March to June 2026
A single dot plot tells you a level. Two in a row tell you a direction, and the direction this year has been violent by the standards of a chart that normally inches.
| Median projection for 2026 | March 18, 2026 | June 17, 2026 | Revision |
|---|---|---|---|
| Federal funds rate | 3.4% | 3.8% | +40 bp |
| PCE inflation | 2.7% | 3.6% | +90 bp |
| Core PCE inflation | 2.7% | 3.3% | +60 bp |
| Unemployment rate | 4.4% | 4.3% | -10 bp |
| Change in real GDP | 2.4% | 2.2% | -20 bp |
Summary of Economic Projections, March 18 and June 17, 2026, Federal Reserve Board. The March median of 3.4% sat below the 3.625% target midpoint; the June median of 3.8% sits above it.
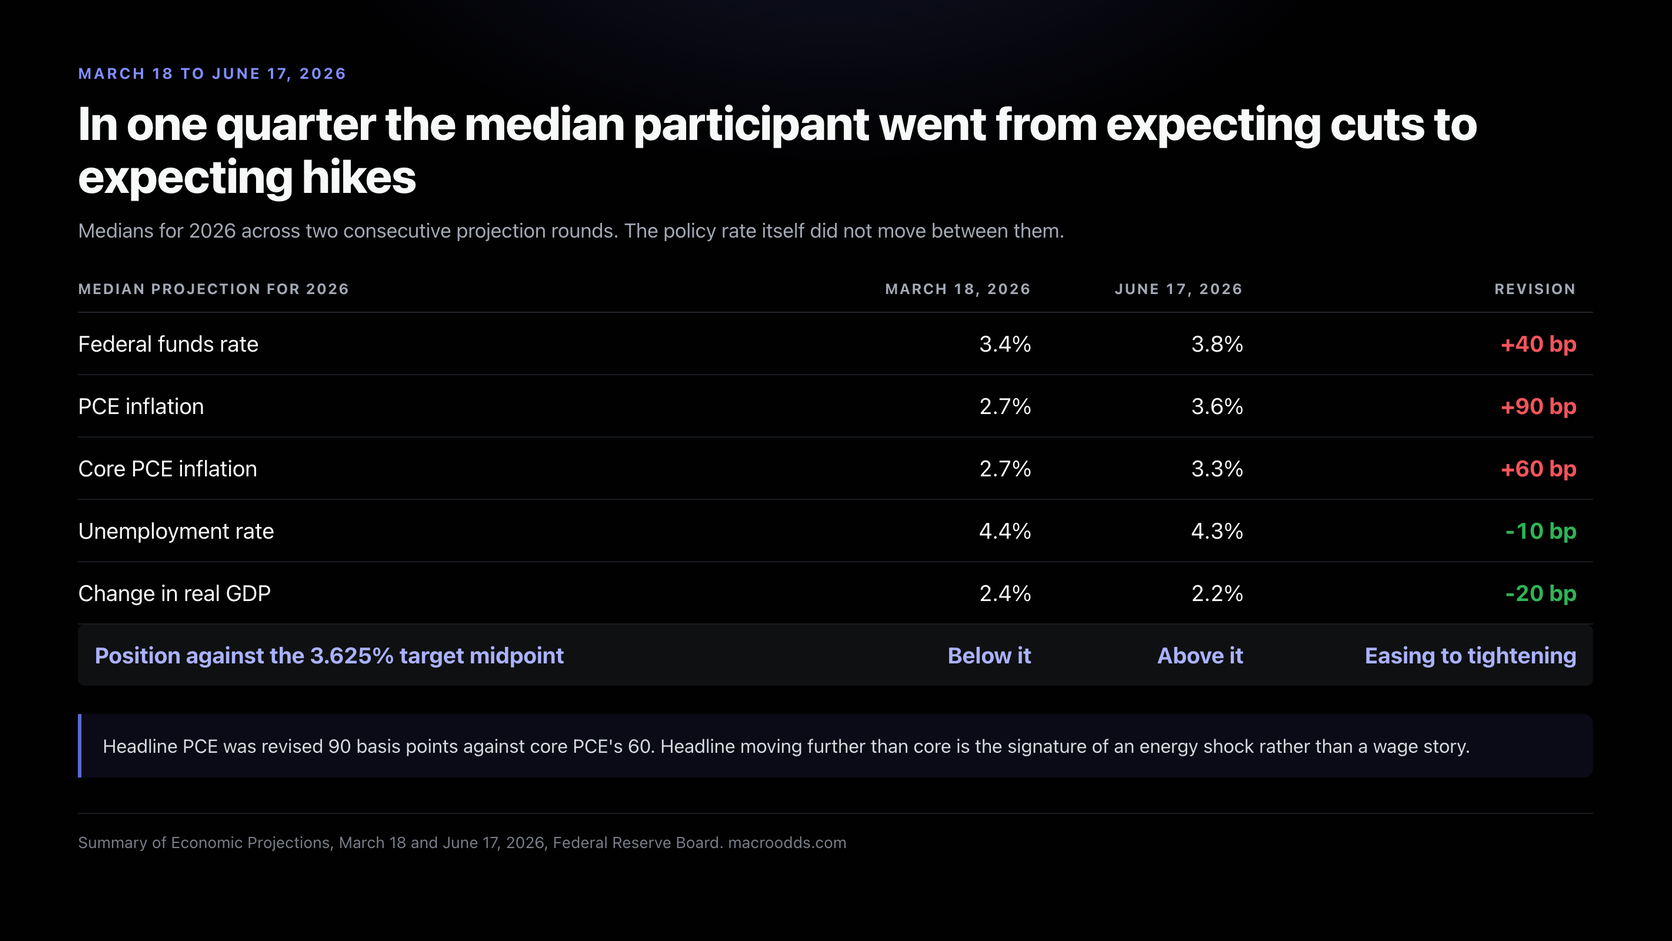
Read the first row against the target range and the whole year turns over. In March the median dot of 3.4% was below the 3.625% midpoint, which is the committee saying it expected to cut before the year was out. In June the median of 3.8% is above it. In one quarter the median participant went from expecting easing to expecting tightening, without the policy rate moving at all.
The inflation rows explain why. A 90 basis point upward revision to the 2026 PCE median inside a single quarter is not a forecasting tweak, it is a committee conceding that the energy shock was not going to pass through quietly. Note that headline was revised further than core, which is the signature of an energy story rather than a wage story. If the distinction between those two gauges is new to you, we laid it out in CPI vs PCE.
What Prediction Markets Price Going Into September 16
The dots are opinions filed a day or two before publication. Prediction markets are opinions with money behind them, repriced continuously, and this morning's CPI print moved them hard. Here is where both venues sit tonight.
| Meeting | Polymarket hike 25 bp | Kalshi hike 25 bp | Kalshi prior close | Polymarket no change |
|---|---|---|---|---|
| September 15-16 | 80.5% | 81% | 63% | 17.5% |
| October 27-28 | 33.5% | 34% | 28% | 65.5% |
| December 8-9 | 60.5% | 58% | 44% | 35.5% |
Captured September 11, 2026, 16:30 UTC. Polymarket via the Gamma API ("Fed Decision in September?", $126.6M volume). Kalshi via last trade on the KXFEDDECISION-26SEP, 26OCT and 26DEC series; the prior close column is the previous session, before this morning's CPI release.
Three things jump out. September went from a coin flip to near-consensus: Polymarket had the hike at 54.5% on September 8 and has it at 80.5% tonight. December moved further in percentage point terms than September did, from 44 to 58 on Kalshi. And October barely moved, which tells you the market reads this as a hike now and a pause, not the start of a run.
The two venues agree to within three points at every meeting, which is worth noting because they usually do not. When Polymarket and Kalshi converge this tightly on a contract with $126.6 million of volume behind it, the price is carrying real information rather than one desk's position. We broke down the venue-by-venue mechanics in Fed rate hike odds September 2026, and the meeting page itself is September 2026 FOMC.
The Gap Between the Dots and the Market, in Basis Points
This is the calculation I could not find anywhere, so here it is with the working shown. Take each meeting's full distribution, weight the outcomes, and you get the market's expected number of 25 basis point moves left in 2026.
| Meeting | Hike 25 | Hike 50+ | Cut 25 | Cut 50+ | Expected net steps |
|---|---|---|---|---|---|
| September 16 | 80.5% | 0.95% | 0.35% | 0.05% | +0.82 |
| October 28 | 33.5% | 0.8% | 2.05% | 0.45% | +0.32 |
| December 9 | 60.5% | 2.15% | 4.15% | 1.15% | +0.58 |
| Total for 2026 | +1.72 |
Polymarket outcome prices, September 11, 2026, 16:30 UTC. A 50+ bp move counts as two steps. Expected net steps is the probability-weighted sum, which is what a rate path is.
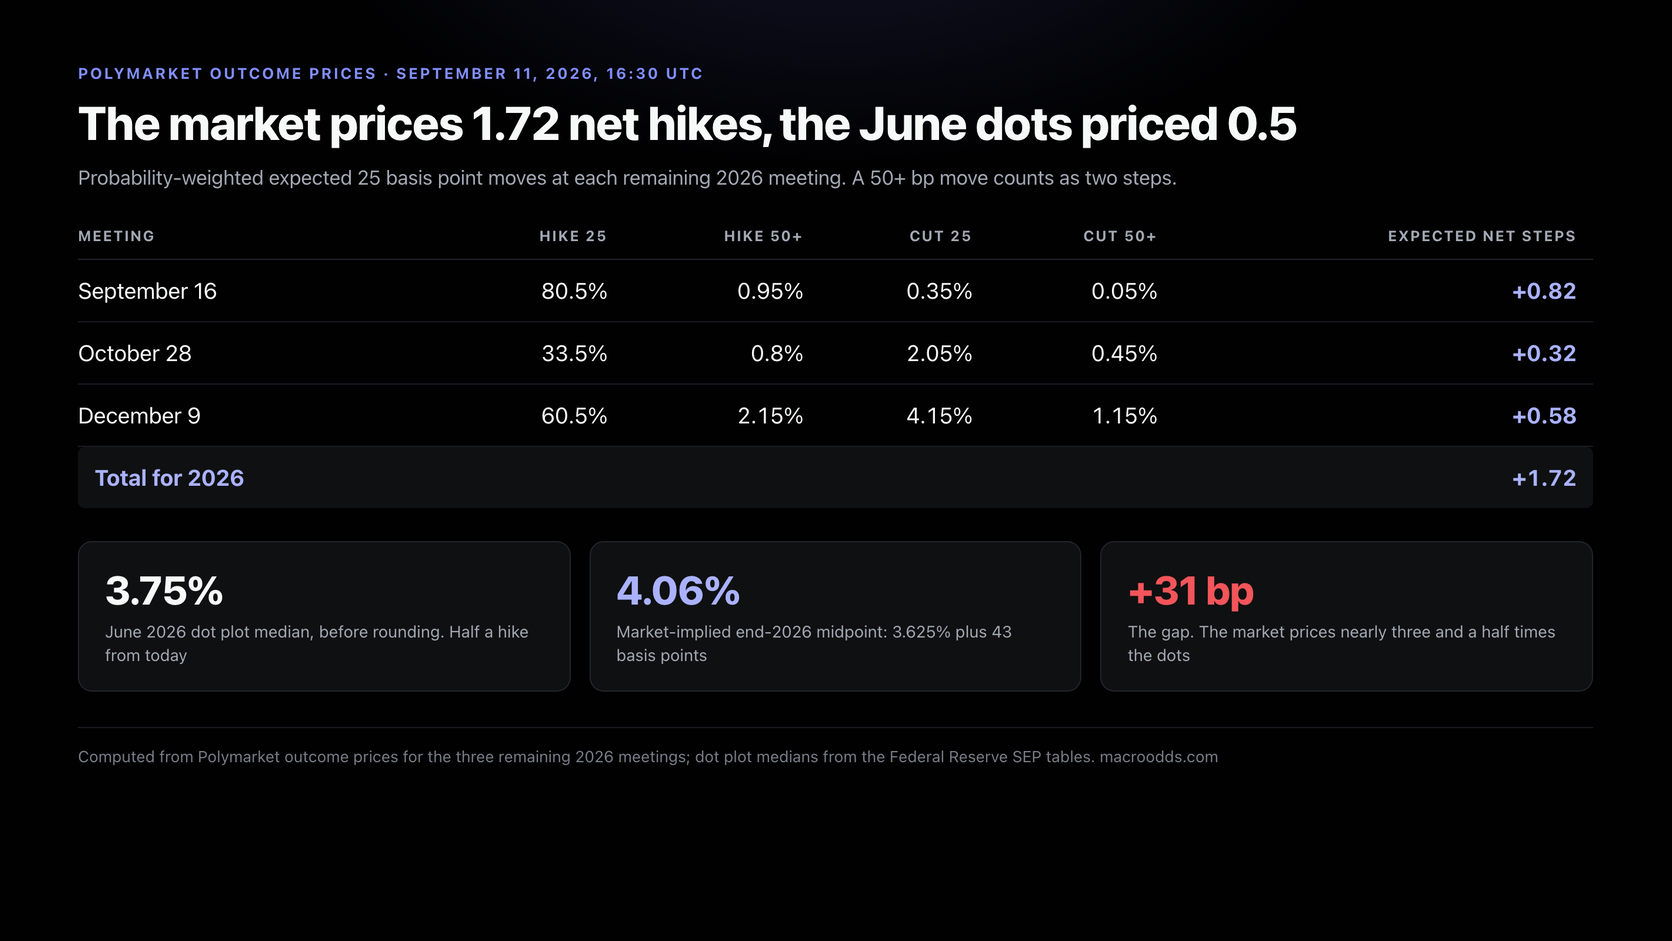
So the market prices 1.72 net hikes of 25 basis points, or 43 basis points, on top of a 3.625% midpoint. That lands the implied end-2026 fed funds midpoint at 4.06%. The June dot plot median was 3.75% before rounding, which is 0.5 of a hike. The market is pricing nearly three and a half times that.
| Measure | Implied end-2026 midpoint | In hikes from today | As of |
|---|---|---|---|
| March 2026 dot plot median | 3.4% | -0.9 (a cut) | Mar 18, 2026 |
| June 2026 dot plot median | 3.75% | +0.5 | Jun 17, 2026 |
| Prediction markets | 4.06% | +1.72 | Sep 11, 2026 |
| Gap, market over June dots | +31 bp | +1.22 | Sep 11, 2026 |
Dot plot medians from the Federal Reserve SEP tables; market-implied path computed from Polymarket outcome prices for the three remaining 2026 meetings. Current target range 3.50-3.75%, midpoint 3.625%.
Thirty-one basis points is not a rounding error and it is not a market that has lost its head. It is the market saying the June dots are three months stale, which they are: they predate the July meeting, Jackson Hole, the August payrolls report and this morning's CPI. The most likely resolution on September 16 is that the dots move up toward the market, not that the market comes down.
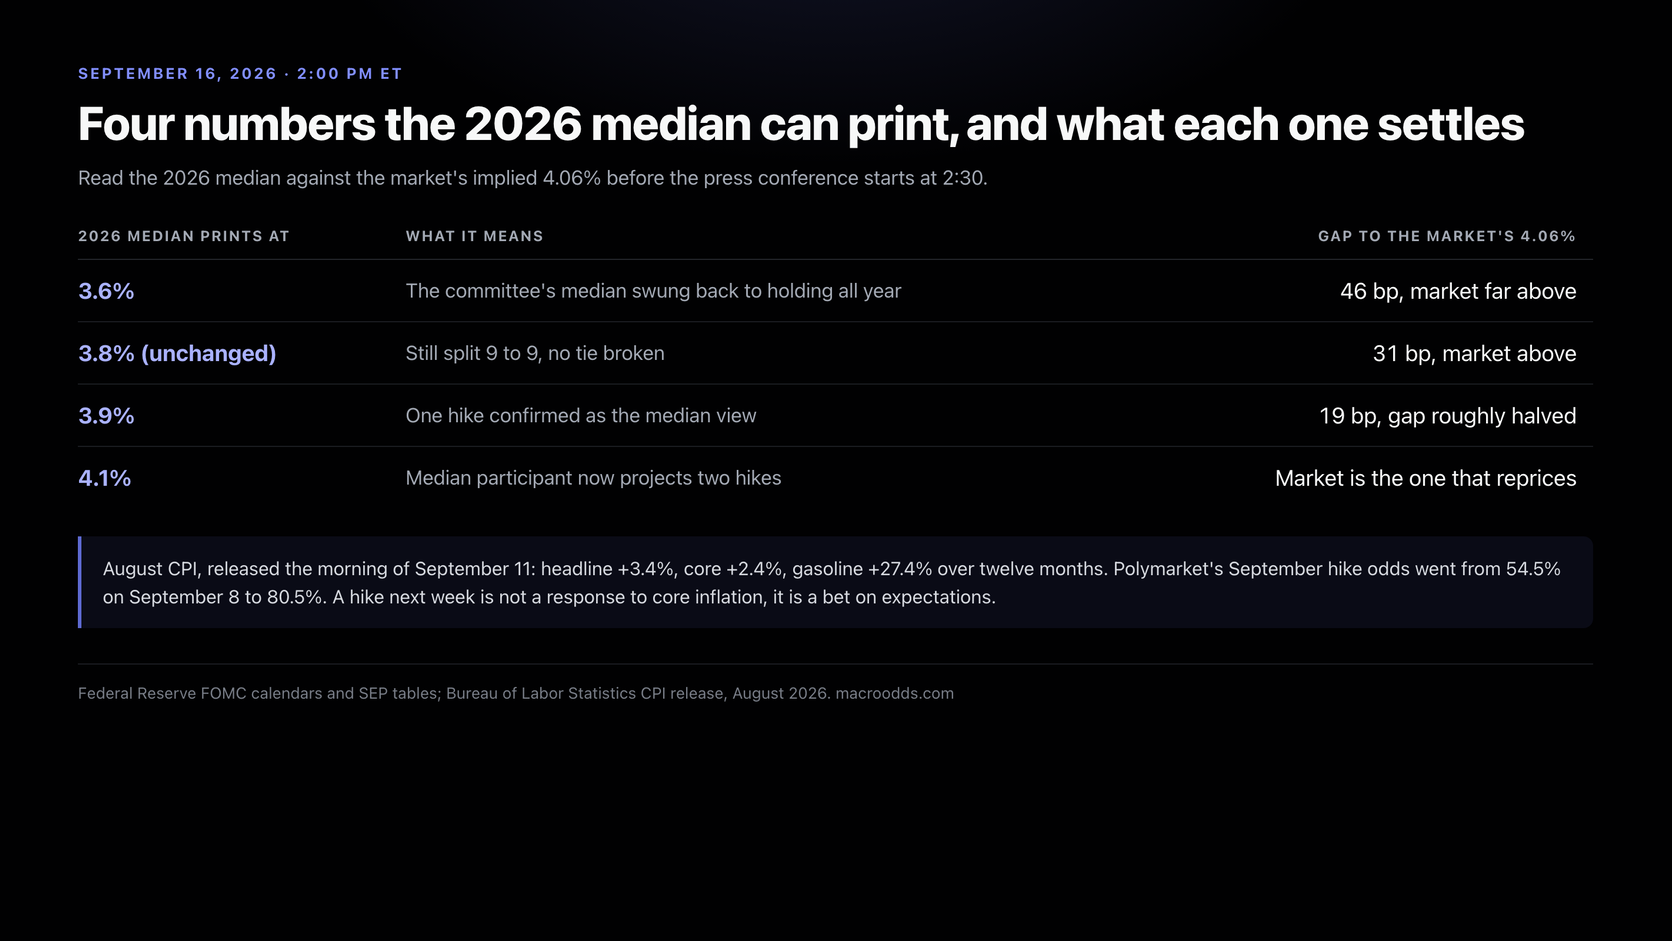
Which gives you a concrete thing to watch. If the September median prints at 3.9%, the committee has confirmed one hike and roughly halved the gap. If it prints at 4.1%, the median participant is now projecting two hikes this year and the market is the one that has to reprice, upward. If it holds at 3.8%, the tie did not break and the chart has told you nothing the July minutes did not.
Why Warsh's Empty Dot Matters More Than Any Single Projection
A chair's dot is not formally weightier than anyone else's, but everybody reads it that way, because the chair usually controls the outcome. Removing it removes the anchor. What Warsh said about why is the most useful sentence any Fed official has offered this year.
Financial market prices are probably the most important source of information to guide central bankers. But when all the financial markets are doing is reflecting back what we've said, then we're taking the most important source of information, and we're being blind to it.
Kevin Warsh, FOMC press conference, June 17, 2026
Take that seriously and the relationship between this chart and the odds in the table above inverts. The old model was that the Fed guides the market. Warsh is describing a Fed that reads the market, and treats guidance as contamination of its own best signal. Under that model a prediction market price is not a bet against the Fed, it is an input to it.
I would not push that too far. Eighteen participants still file dots, the SEP still publishes, and the committee still votes. But it does explain why the 2026 dot plot has been a poor predictor of its own policy rate this year while the markets have tracked it closely, and it is a reason to weight the September chart less than you would have weighted a Powell-era one.
It also raises a live risk that nobody prices: Warsh has floated reforming or scrapping the projections altogether. If September 16 brings a change to the format rather than a change to the numbers, every model built on dot plot continuity has to be rebuilt. We keep the meeting-by-meeting schedule in the 2026 FOMC calendar.
What This Morning's CPI Did to the September Meeting
August CPI landed at 8:30 am ET today, and it is the last inflation print before the decision. It is also a genuinely awkward report for anyone who wants a clean story.
| Index (August 2026) | Monthly, seasonally adjusted | 12-month |
|---|---|---|
| All items | +0.4% | +3.4% |
| All items less food and energy | +0.3% | +2.4% |
| Energy | +2.1% | +16.3% |
| Gasoline | +3.9% | +27.4% |
| Shelter | +0.3% | +3.0% |
| Food | +0.1% | +2.7% |
Consumer Price Index Summary, August 2026, U.S. Bureau of Labor Statistics, released September 11, 2026. The BLS notes gasoline accounted for over one third of the monthly all-items increase.
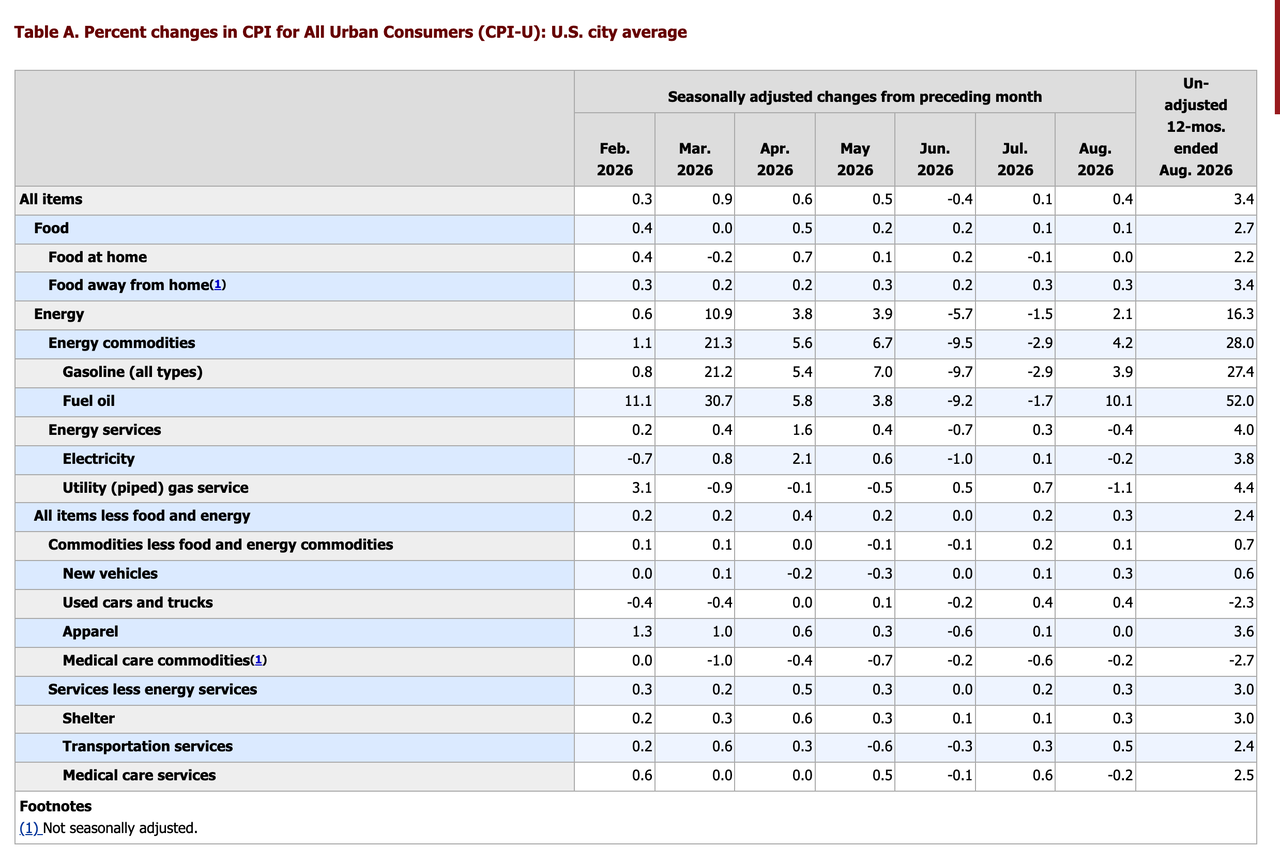
Headline at 3.4% and core at 2.4% is a full percentage point of wedge, and gasoline up 27.4% over the year is doing nearly all of it. Strip energy out and inflation is running four tenths above target, which in most years is a committee that holds and waits. So a hike next week is not a response to core inflation. It is a bet on expectations.
That is the honest way to frame the decision, and it is where I part company with the confident takes. Tightening into an energy shock is a defensible choice when you are worried that a year of 3%-plus headline prints unanchors the public's expectations, and it is a mistake when the shock is a supply story that unwinds on its own. Reasonable people on that committee disagree, which is exactly what the 9-to-9 split was telling us in June.
Markets did not agonise. The hike contract went from 63 cents to 81 cents on Kalshi in a session. We track the pricing on inflation prints themselves at CPI inflation prediction, and the full release calendar sits on our economic calendar.
How to Read the September 16 Dot Plot in Ninety Seconds
The chart drops at 2:00 pm ET and most of the move happens before the press conference starts at 2:30. Here is the order I read it in, which is not the order the coverage reports it in.
- Count the dots. Eighteen or nineteen. If Warsh has filed one, that is the story, ahead of any number on the page.
- Find the 2026 median and compare it to 3.8%. 3.9% breaks the tie toward one hike. 4.1% means the median participant now wants two. Unchanged at 3.8% means the committee is still split.
- Read the 2027 median next. June had it at 3.6%, below 2026. If that inverts and 2027 prints at or above 2026, the committee has stopped describing this as a temporary tightening.
- Check the dispersion, not just the median. June's full range for 2026 ran 3.4% to 4.4%, a full percentage point. A narrowing range matters more than a median that shifts one notch.
- Then look at core PCE for 2026. June had 3.3%. A downward revision alongside a higher rate path is a committee tightening even as it expects less inflation, which is the most hawkish combination available to it.
| 2026 median prints at | What it means | Gap to the market's 4.06% |
|---|---|---|
| 3.6% | The committee's median swung back to holding all year | 46 bp, market far above |
| 3.8% (unchanged) | Still split 9 to 9, no tie broken | 31 bp, market above |
| 3.9% | One hike confirmed as the median view | 19 bp, gap roughly halved |
| 4.1% | Median participant now projects two hikes | Market is the one that reprices |
Reference points for the September 16, 2026 release, against a market-implied end-2026 midpoint of 4.06% and a current target midpoint of 3.625%.
The trap in all of this is treating the dots as a forecast of what the Fed will do. They are a conditional statement of what each participant thinks would be appropriate given their own economic projection, and both halves move. A participant who marks a higher rate because they revised inflation up has told you about their inflation view, not about their reaction function.
For the longer-horizon version of this question, which is a different exercise with wider error bars, we keep when will the Fed cut rates updated against the same data.
My own expectation, for what one reader's read is worth: a 3.9% median, a hike, and a 2027 dot that creeps up rather than the clean tighten-then-unwind shape June described. The reason is the third table. A 31 basis point gap between an April-to-June committee view and a September market view usually closes from the committee's side, because the committee is the one working from stale information. The one thing that would surprise me is the chart looking exactly as it did in June, and even that would tell you something: that a committee split 9 to 9 in the summer is still split going into the autumn, with two meetings left to break it.
Frequently asked questions
When is the next Fed dot plot released?
The next dot plot is published at 2:00 pm ET on Tuesday September 16, 2026, with the FOMC statement at the end of the September 15-16 meeting. It is the third of four projection rounds in 2026. The final one comes with the December 8-9 meeting. The October 27-28 meeting does not carry projections.
What did the June 2026 Fed dot plot show?
The June 17, 2026 dot plot had a median end-2026 federal funds rate of 3.8%, with a central tendency of 3.6% to 4.1% and a full range of 3.4% to 4.4%. Nine participants projected at least one hike this year, six of them more than one, and nine projected the rate unchanged or lower. The 2027 median was 3.6% and the longer-run median 3.1%.
Why is the median dot 3.8% when the Fed moves in 25 basis point steps?
Because the median of an even number of dots is an average, not a dot. Eighteen participants filed in June, so the median is the midpoint of the ninth and tenth values. Those sat at 3.625% (the current range) and 3.875% (one hike), averaging 3.75% and publishing as 3.8%. No individual participant projected 3.8%, and none could: the target range midpoints available to them are 3.6%, 3.9% and 4.1%.
Why did Fed Chair Kevin Warsh not submit a dot?
Warsh is a long-standing critic of forward guidance and said at his June 2026 press conference that the projection exercise is "not helpful in the conduct of policy" for him personally, while encouraging colleagues to keep filing theirs. The same meeting cut the policy statement to roughly 130 words and removed its forward guidance language. Eighteen of the nineteen participants submitted federal funds projections in June.
What do prediction markets say about the September 2026 Fed decision?
As of 16:30 UTC on September 11, 2026, Polymarket prices a 25 basis point hike on September 16 at 80.5% and Kalshi at 81%, against 17.5% and 18% for no change. Both jumped after the August CPI release that morning; Kalshi's hike contract closed the prior session at 63 cents. Polymarket prices an October hike at 33.5% and a December hike at 60.5%.
Is the dot plot a promise about future interest rates?
No. Each dot is a conditional judgement about what would be appropriate given that participant's own economic projection, filed shortly before publication and not binding on anyone. The Fed states plainly that the projections are not a committee decision or a commitment. The March 2026 median implied a cut by year end; three months later the June median implied a hike, with no policy change in between.
How far apart are the Fed's dots and market pricing right now?
About 31 basis points. Probability-weighting Polymarket's outcomes across the three remaining 2026 meetings gives 1.72 expected net hikes of 25 basis points, which on the current 3.625% midpoint implies an end-2026 rate of 4.06%. The June dot plot median was 3.75% before rounding, equivalent to roughly half a hike. The gap exists largely because the June dots predate Jackson Hole, the August payrolls report and August CPI.
What should I watch first when the September dot plot is published?
Count the dots to see whether the chair filed one, then compare the 2026 median with June's 3.8%. A 3.9% median breaks the tie toward one hike, 4.1% means the median participant wants two, and an unchanged 3.8% means the committee is still split. After that, check whether the 2027 median still sits below 2026, and look at the dispersion of the full range rather than the median alone.
Sources
- Summary of Economic Projections, June 17, 2026, Federal Reserve Board
- Summary of Economic Projections, March 18, 2026, Federal Reserve Board
- FOMC statement, June 17, 2026, Federal Reserve Board
- Consumer Price Index Summary, August 2026, U.S. Bureau of Labor Statistics
- FOMC meeting calendars and information, Federal Reserve Board