Jobs Report Prediction September 2026: 50k-100k

Every September jobs report preview you can find gives you a single consensus number, usually the 50,000 that Capital Economics published, and then stops. The jobs report prediction markets give you the whole distribution instead, and this month that distribution contains an argument worth reading. I pulled both full outcome ladders from Polymarket's Gamma API and Kalshi's public market endpoints this afternoon, normalised the books, differenced Kalshi's cumulative strikes into a point distribution, and set the result against what the Bureau of Labor Statistics has actually been printing.
The two venues do not disagree the way they usually do. On the unemployment rate they are almost identical. On payrolls they are miles apart in one specific bucket, and the venue that looks wrong is the more liquid one. That is unusual enough that it is the whole reason this piece exists.
Below: where both books sit, the arithmetic behind each bucket, what the last two reports did to the people pricing them, how the resolution rules can pay opposite ways on the same number, and what the print does to the October Fed decision. All prices were captured on September 25, 2026 at 16:30 UTC.
September Jobs Report Prediction: Where the Market Sits
Polymarket runs the September payroll print as seven separate binary contracts, one per bracket. Each is priced on its own book, so the raw column does not sum to 100%. The normalised column is the honest probability.
| September nonfarm payrolls | Polymarket last price | Normalised | Market volume |
|---|---|---|---|
| Below -50,000 | 6.0% | 5.7% | $941 |
| -50,000 to 0 | 6.5% | 6.2% | $1,097 |
| 0 to 50,000 | 5.0% | 4.7% | $1,356 |
| 50,000 to 100,000 | 37.5% | 35.5% | $1,241 |
| 100,000 to 150,000 | 34.5% | 32.7% | $5,306 |
| 150,000 to 200,000 | 11.4% | 10.8% | $604 |
| Above 200,000 | 4.8% | 4.5% | $776 |
| Implied total | 105.6% | 100% | $11,322 |
Polymarket event "How many jobs added in September?", captured September 25, 2026, 16:30 UTC. The raw column sums to 105.6% because each bracket is an independently priced binary and the 5.6% overround belongs to the spread.
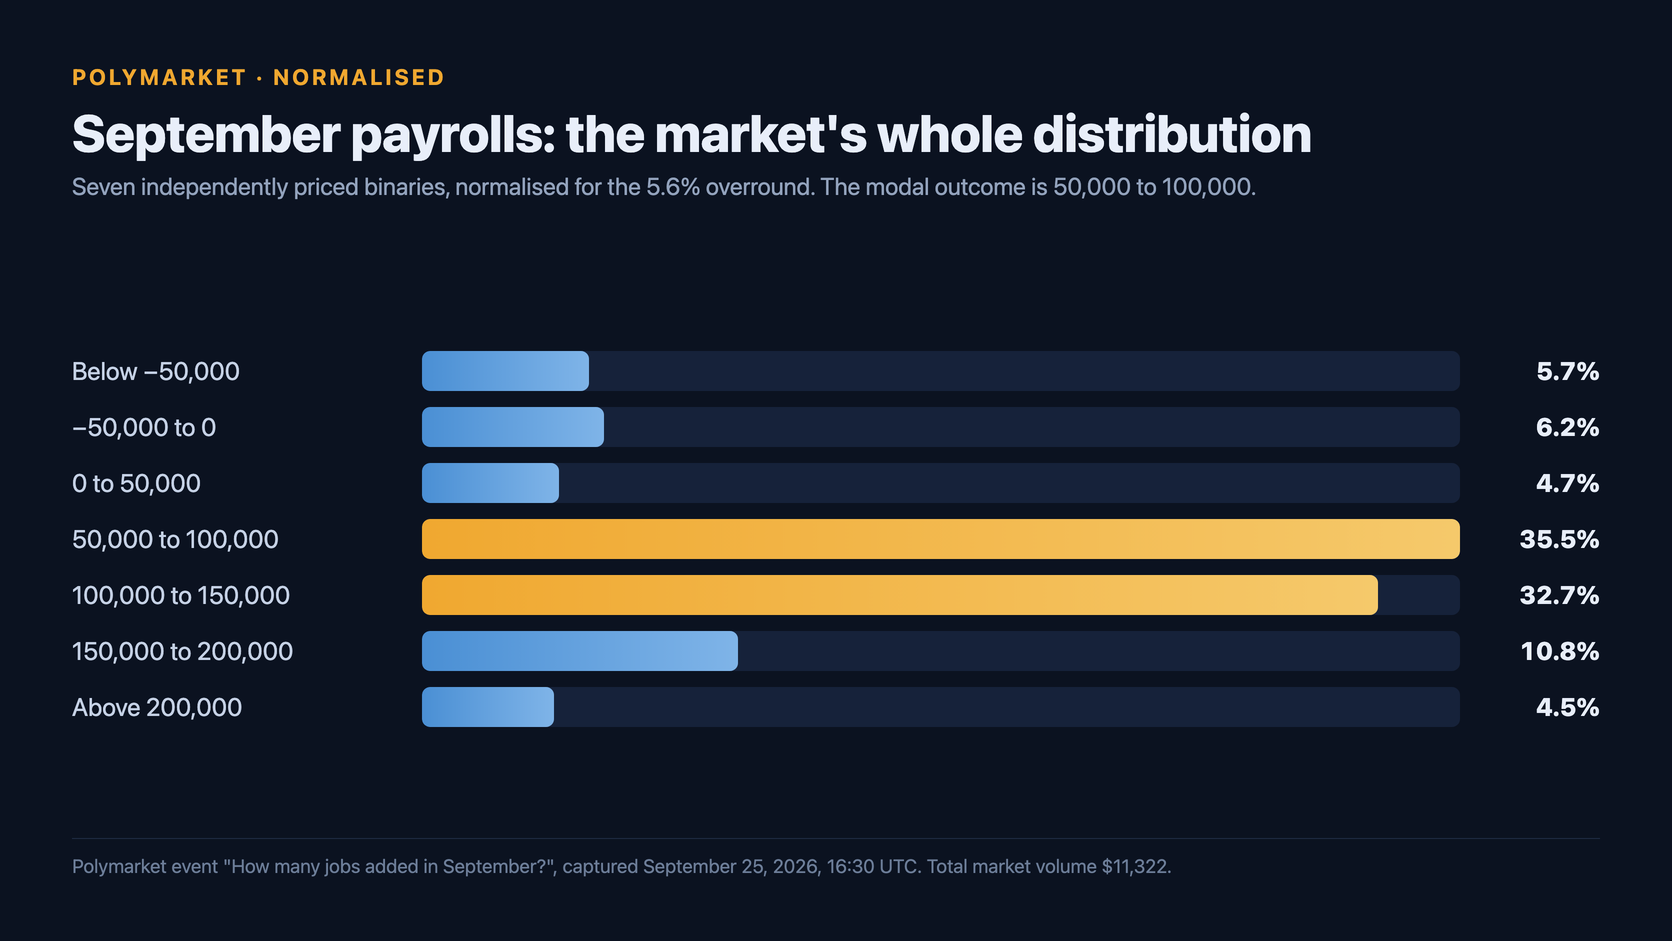
The centre of gravity is 50,000 to 150,000, which holds 68.2% of the normalised probability across two brackets. The market is pricing a month that looks like the recent trend rather than a break from it, which is a reasonable default.
What catches the eye is the third row. Polymarket gives a print between zero and 50,000 jobs a 4.7% chance, thinner than an outright loss of more than 50,000 jobs at 5.7%. Hold that thought, because Kalshi does not agree and the official data does not either.
The volume is lopsided too. Over $5,300 of the $11,322 total sits on the 100,000 to 150,000 bracket, while the modal bracket carries $1,241. This is a small book with uneven attention, which matters when you read a 4.7%.
The Unemployment Rate Forecast Says 4.1%, Again
There is a second, larger market on the same release. Polymarket's September unemployment rate book runs nine contracts on the seasonally adjusted U-3 rate to one decimal place, and it carries more than twice the volume of the payroll book.
| September U-3 unemployment rate | Polymarket last price | Normalised | Market volume |
|---|---|---|---|
| 3.8% or lower | 1.3% | 1.1% | $2,183 |
| 3.9% | 6.8% | 6.1% | $836 |
| 4.0% | 19.0% | 17.3% | $2,334 |
| 4.1% | 40.5% | 36.9% | $7,092 |
| 4.2% | 29.5% | 26.8% | $4,964 |
| 4.3% | 9.0% | 8.2% | $2,531 |
| 4.4% | 2.6% | 2.4% | $1,448 |
| 4.5% | 0.8% | 0.7% | $1,477 |
| 4.6% or higher | 0.6% | 0.5% | $1,134 |
| Implied total | 109.9% | 100% | $23,999 |
Polymarket event "September Unemployment Rate", captured September 25, 2026, 16:30 UTC. The 9.9% overround is wider than the payroll book's, which is what you expect from a nine-way split.
The modal call is 4.1%, unchanged from August, at 36.9%. Add 4.2% and you have 63.7% of the mass in two tenths. The market thinks this rate is sticky, and it has been: 4.1% is where August printed, with 7.0 million people counted as unemployed.
The asymmetry is upward. Everything at 4.2% or above totals 38.6% normalised, against 24.6% for 4.0% or below. So the market leans towards the rate drifting up, not down, even while it prices a decent payroll number. Those two things can both be true and the reason why is the most useful thing in this article.
Kalshi Prices the Same Report as a Cumulative Ladder
Kalshi does not run buckets. Both of its September labour markets are ladders of "Above X" contracts whose strike type is greater, so every contract is strictly greater than its strike. Because the BLS prints payrolls in thousands and U-3 to one decimal, you can difference adjacent strikes and recover a clean point distribution that is directly comparable to Polymarket's brackets.
| Kalshi contract | Bid | Ask | Mid | Open interest |
|---|---|---|---|---|
| KXPAYROLLS-26SEP-T0 (above 0) | $0.88 | $0.89 | 88.5% | 7,135 |
| KXPAYROLLS-26SEP-T50000 (above 50,000) | $0.68 | $0.69 | 68.5% | 2,291 |
| KXPAYROLLS-26SEP-T70000 (above 70,000) | $0.61 | $0.62 | 61.5% | 2,883 |
| KXPAYROLLS-26SEP-T90000 (above 90,000) | $0.51 | $0.52 | 51.5% | 2,888 |
| KXPAYROLLS-26SEP-T100000 (above 100,000) | $0.37 | $0.38 | 37.5% | 14,088 |
| KXPAYROLLS-26SEP-T125000 (above 125,000) | $0.28 | $0.30 | 29.0% | 4,282 |
| KXU3-26SEP-T4.0 (above 4.0%) | $0.68 | $0.71 | 69.5% | 11,549 |
| KXU3-26SEP-T4.1 (above 4.1%) | $0.36 | $0.37 | 36.5% | 10,332 |
| KXU3-26SEP-T4.2 (above 4.2%) | $0.11 | $0.13 | 12.0% | 16,481 |
Selected strikes from Kalshi series KXPAYROLLS-26SEP and KXU3-26SEP, captured September 25, 2026, 16:30 UTC. Read from the single-market endpoint's yes_bid_dollars and yes_ask_dollars fields; the legacy cent fields on the list endpoint return null and are no longer populated.
One oddity is worth flagging because it tells you something about the book's depth. The above 70,000 and above 80,000 strikes are both quoted at 61.5%, which implies a literal zero probability that the print lands anywhere between 70,001 and 80,000. That is not a view, it is a stale quote in a thin part of the ladder, and it is a reminder that differencing adjacent strikes only works where both are actually being traded.
Differencing the strikes that are traded gives the comparison that matters.
Where the Two Venues Actually Disagree
Here is the whole argument in one table: Polymarket's normalised brackets against the same brackets derived from Kalshi's ladder.
| September payrolls | Polymarket (normalised) | Kalshi (differenced) | Gap |
|---|---|---|---|
| A negative print (below 0) | 11.8% | 11.5% | +0.3 pts |
| 0 to 50,000 | 4.7% | 20.0% | -15.3 pts |
| 50,000 to 100,000 | 35.5% | 31.0% | +4.5 pts |
| Above 100,000 | 47.9% | 37.5% | +10.4 pts |
| Above 125,000 | n/a (bracket splits) | 29.0% | n/a |
Polymarket brackets normalised for the 5.6% overround; Kalshi buckets derived by differencing adjacent "Above X" mids. Both captured September 25, 2026, 16:30 UTC.
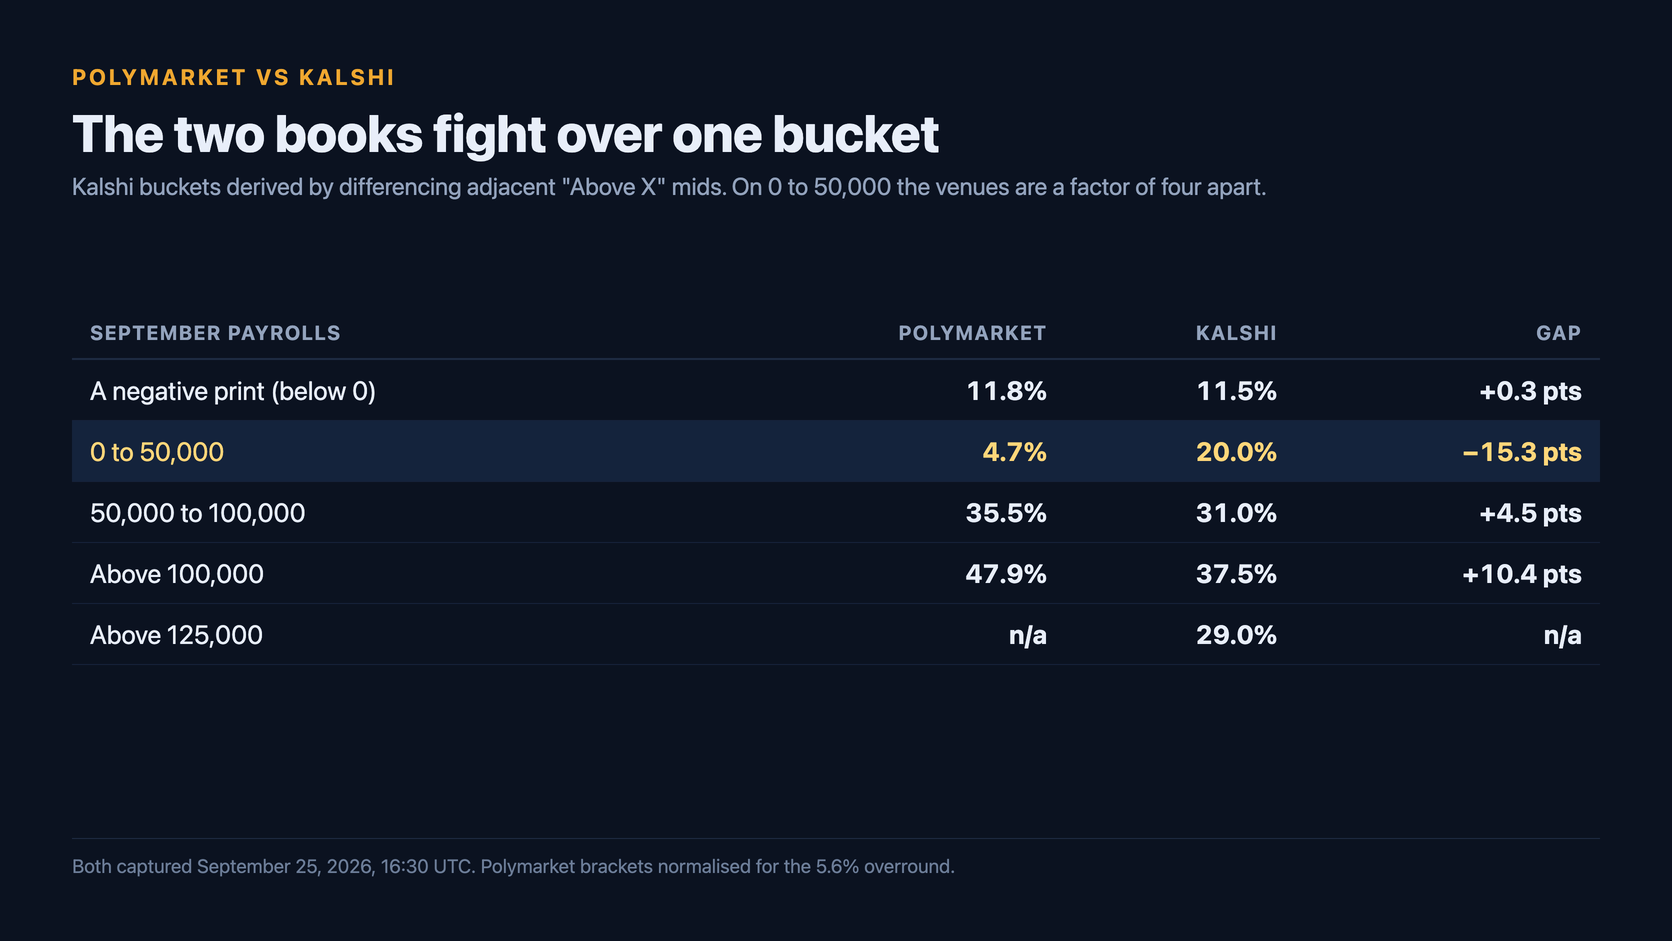
Look at the first row and the second row together, because that pairing is the finding. On the probability of an outright job loss the two venues are inside 0.3 of a point, which is about as tight as two independent books ever get. On the bucket immediately above it they are 15.3 points apart.
That is not a disagreement about the economy. Both books agree firing is rare. They disagree about what weak-but-positive hiring looks like, and only one of them has the base rate on its side.
The unemployment side, for contrast, is boring in the best way. Polymarket's normalised 4.1% is 36.9% against Kalshi's differenced 33.0%. On 4.0% it is 17.3% against 22.0%, and on 4.2% it is 26.8% against 24.5%. No outcome differs by more than 4.7 points. Two books with different users, different collateral and a 9.9% versus tighter overround land on the same household survey call.
The Base Rate Argues Against Polymarket's 4.7%
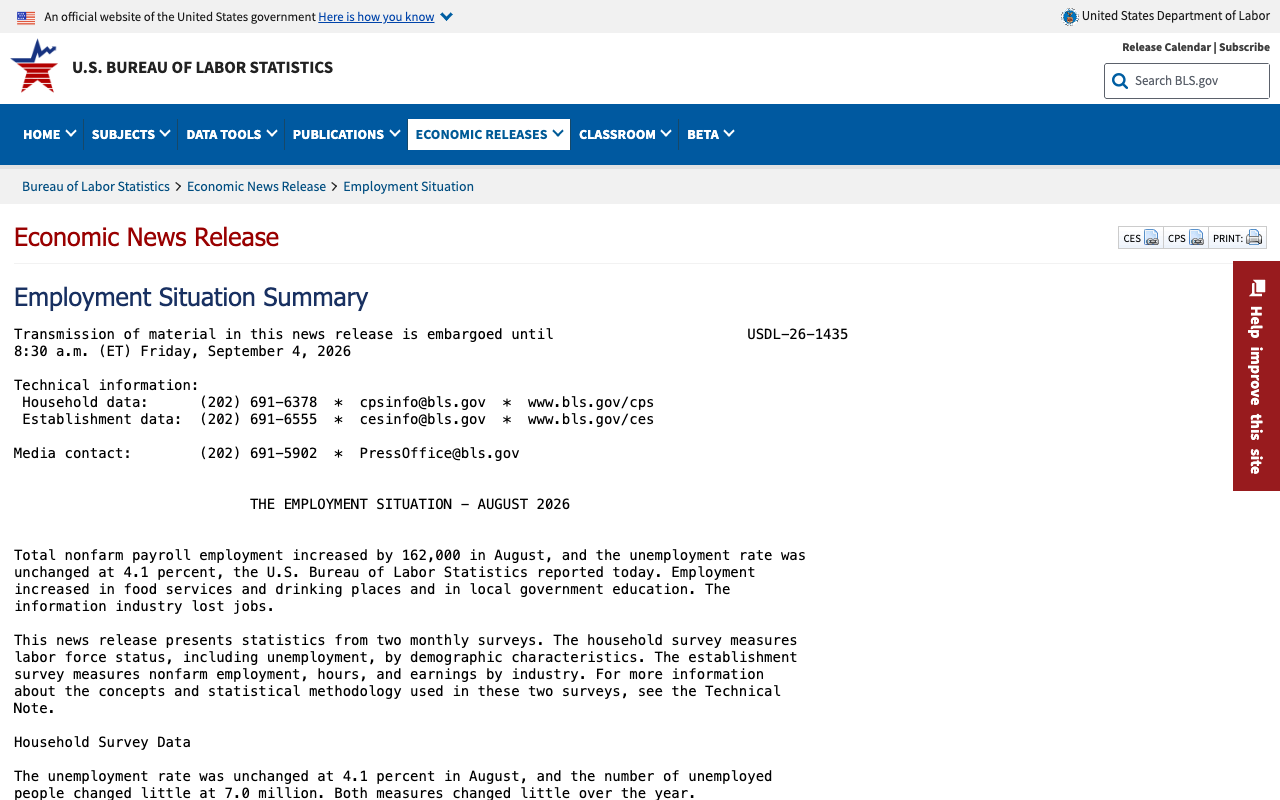
This is where the official data earns its place. The August Employment Situation release states plainly that job growth has averaged 31,000 per month over the prior 12 months. That is the BLS's own figure, in the release, not a calculation of mine.
31,000 sits inside the 0 to 50,000 bucket. So the single most common recent outcome, the twelve-month average itself, lands in the bracket Polymarket prices at 4.7% and Kalshi prices at 20.0%. A market that gives last year's average month a 1-in-21 chance is telling you something has structurally changed, and it needs a reason.
The reason it has is August. Payrolls rose 162,000 in August against a 53,000 consensus, and the three months before the September print now read 31,000 for June, 21,000 for July and 162,000 for August. That is a three-month average of 71,300, which is exactly where Polymarket's modal bracket sits.
| Window | Average monthly payroll gain | Which bracket it lands in |
|---|---|---|
| Prior 12 months (per BLS) | 31,000 | 0 to 50,000 |
| Last 3 months (Jun, Jul, Aug) | 71,300 | 50,000 to 100,000 |
| August 2026 alone | 162,000 | 150,000 to 200,000 |
| Consensus for September | 50,000 | On the 0 / 50,000 boundary |
| 2023-2024 monthly average | 166,000 | 150,000 to 200,000 |
The forecast problem in five rows. Depending on which window you anchor to, the defensible answer moves across four of Polymarket's seven brackets. Twelve-month and monthly figures from the BLS August 2026 Employment Situation; the September consensus is Capital Economics' published 50,000.
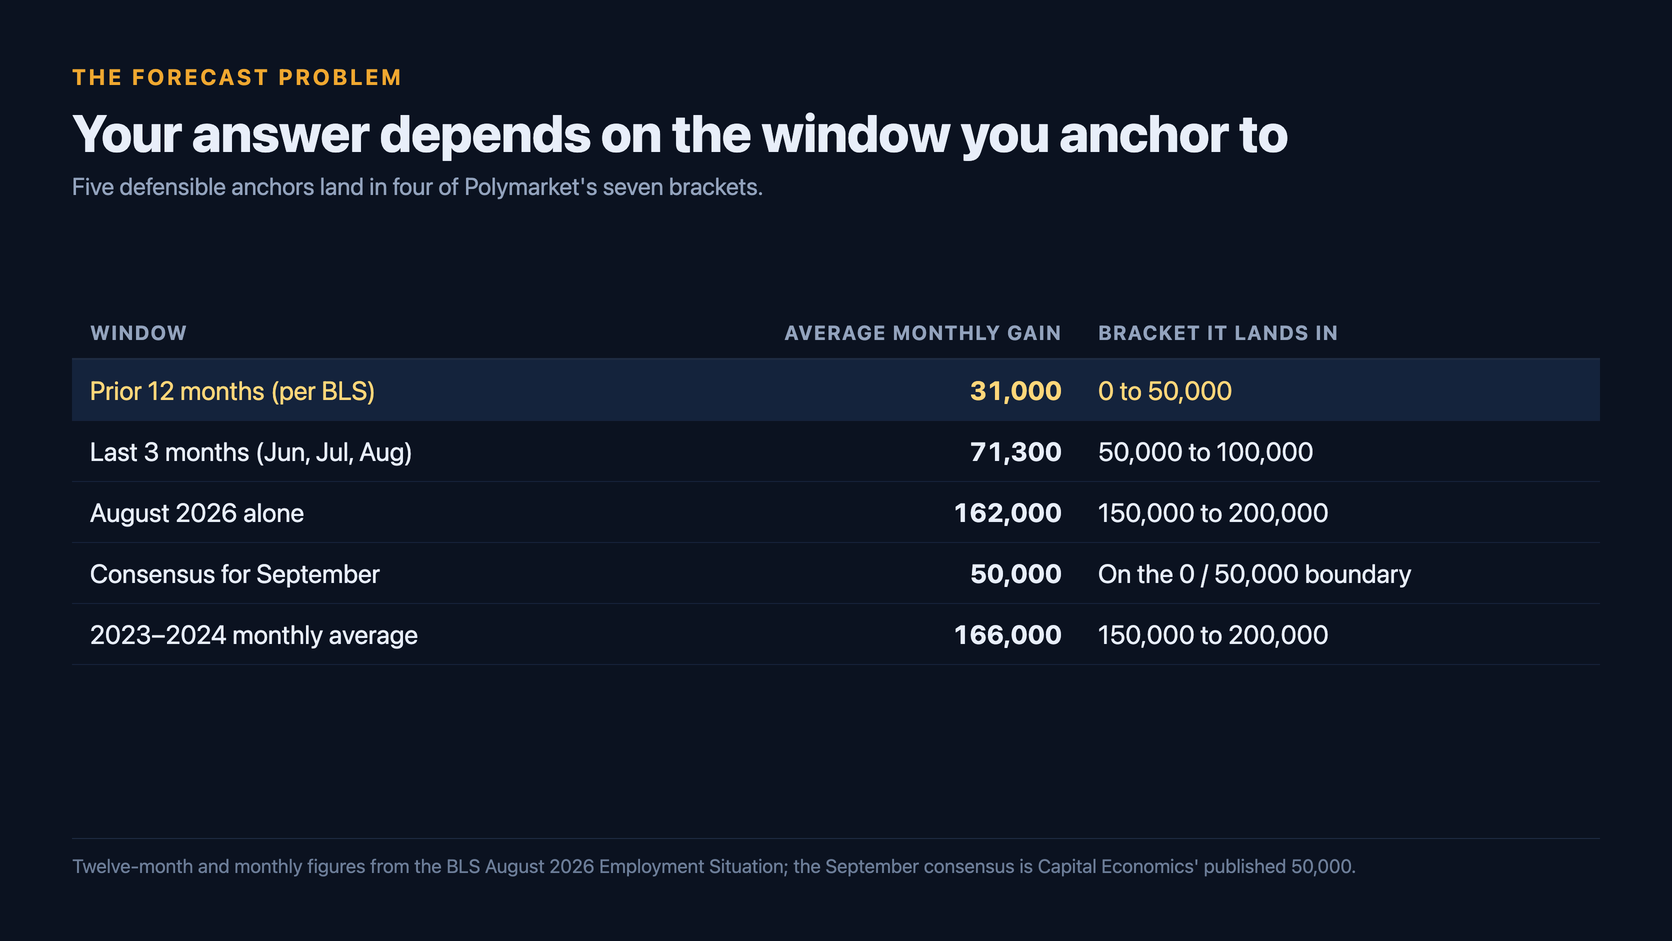
So the honest read is that the anchor you pick decides your answer, and the market has picked the three-month anchor. That is a defensible choice. Pricing the twelve-month anchor at 4.7% while pricing an outright job loss at 5.7% is not, because the twelve-month average is a far more frequent outcome than a 50,000-job contraction.
My own view: Kalshi's 20.0% on 0 to 50,000 is closer to right than Polymarket's 4.7%, and if I had to name the mispriced contract in either book it is that one. June and July printed 31,000 and 21,000 four and three months ago. Nothing that has happened since makes a repeat a 1-in-21 event.
Both Books Got the Last One Badly Wrong
Before anyone treats these numbers as gospel, look at what the same markets said a month ago. Going into the August report, prediction market traders were pricing a coin flip on clearing 50,000 jobs.
| Report | Pre-release market odds | Consensus | Actual print | Verdict |
|---|---|---|---|---|
| August 2026 | Kalshi ~50% above 50,000; Polymarket 48% | 53,000 | 162,000 | Both books far too low |
| April 2026 | Kalshi ~50% at 66,000+; only 30% above 100,000 | 53,000 | 115,000 | Kalshi too low again |
| September 2026 | Kalshi 37.5% above 100,000; Polymarket 47.9% | 50,000 | Reports October 2 | Open |
Pre-release prediction market pricing versus the first print, from contemporaneous CNBC reporting on the Kalshi and Polymarket books. Both reports resolved above the market's median, and April's Kalshi book put only a 30% chance on the 100,000-plus outcome that happened.
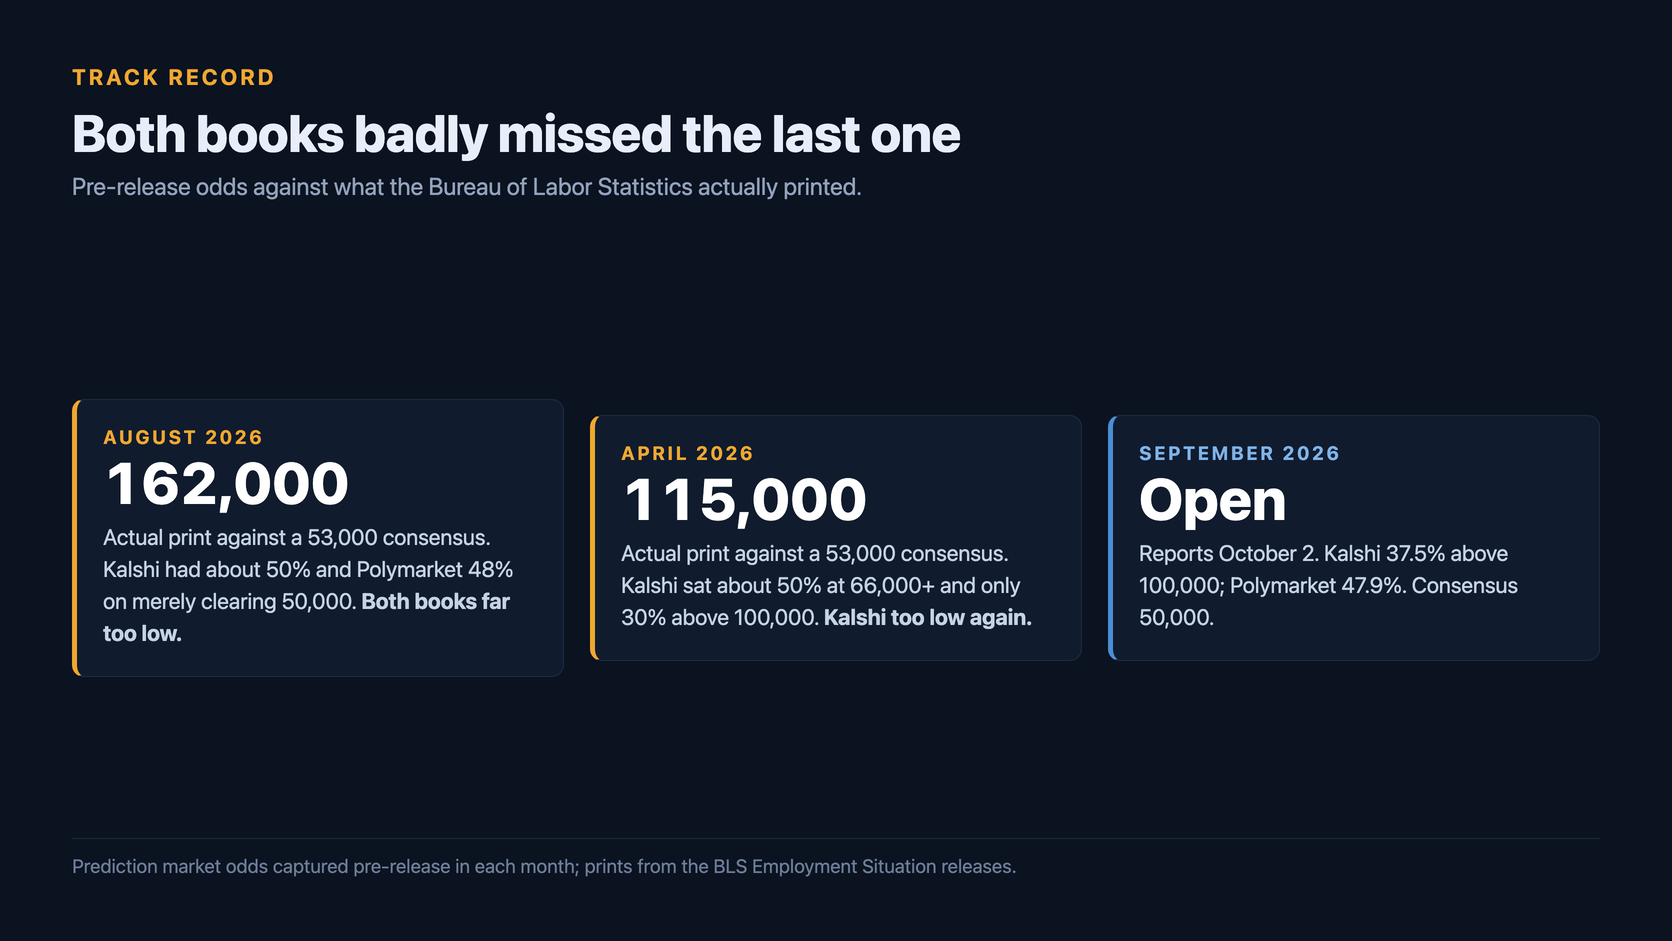
Two data points is not a track record, and I am not claiming these markets are systematically biased low. But the direction of both misses was the same, and both were misses on the low side in a labour market everyone had written off as stalling. Worth holding in mind before you read 11.8% on a negative print as a considered view.
If you want the running version of this exercise across every macro contract this site tracks, that is what the MacroOdds scorecard is for.
Why the Payroll and Unemployment Markets Are Not Redundant
A reasonable objection: if payrolls come in strong, surely unemployment falls, so why does the market price a decent payroll number and a drifting-up jobless rate at the same time? Because they come from two different surveys, and August is the cleanest recent demonstration of it.
Payrolls come from the establishment survey, a count of jobs on business payrolls. The unemployment rate comes from the household survey, a count of people and how they describe their own status. The two can move in opposite directions for a whole month without either being wrong.
In August, payrolls rose 162,000 and the labour force participation rate rose from 61.4% to 61.6%, while the unemployment rate held at 4.1%. More people entered the labour force than the household survey found jobs for, so a strong establishment print produced a flat jobless rate. If participation rises again in September, a 100,000 payroll month can arrive alongside 4.2% unemployment quite comfortably.
This is the mechanism the Atlanta Fed's jobs calculator exists to quantify: how many jobs per month are needed to hold the unemployment rate at a given level under a given participation assumption. Move participation by two tenths and the answer moves by tens of thousands of jobs. That is why holding a position in both markets is not doubling down on one view.
It also explains the upward tilt in the unemployment book. Participation rising into a low-hiring labour market mechanically pushes the measured rate up, and the household survey has been the noisier of the two all year.
Jobless Claims Say Nobody Is Being Fired
The weekly data between now and October 2 has already largely landed, and it points one way. Initial jobless claims were 197,000 in the week ended September 19, down 1,000 and the lowest since mid-July. Claims have spent most of 2026 below 220,000, which is close to 57-year lows in a labour force far larger than it was in 1969.
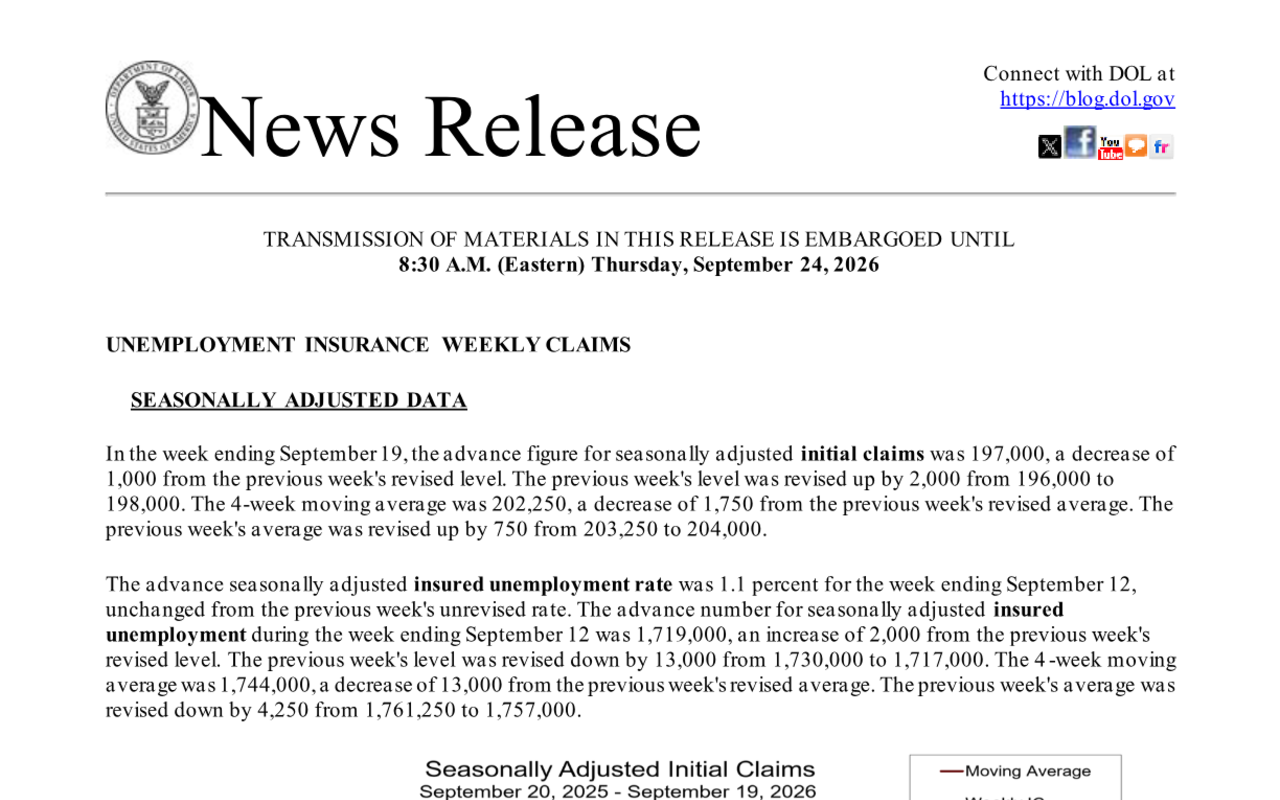
Continuing claims fell to a more-than-two-year low in the same week. On the layoff side there is simply nothing happening, and that is what both books are pricing when they agree within 0.3 of a point that a negative print is an 11.5% to 11.8% event.
This is the low-hiring, low-firing economy, and it is genuinely hard to forecast: the usual recession tells are absent, the usual expansion tells are absent too, and the monthly print swings on survey noise and seasonal factors. It is also why the recession odds market has been so stable while the monthly prints have been erratic.
The Resolution Rules Differ, and 100,000 Is the Trap
If you trade both venues on the same release, read both rulebooks, because they are not the same document and one number pays opposite ways.
- Kalshi is strictly greater. Every strike is typed as greater, so "Above 100,000" needs 100,001 or more. A print of exactly 100,000 resolves No.
- Polymarket rounds ties upward. Its rules state that if the reported value falls exactly between two brackets, the market resolves to the higher bracket. A print of exactly 100,000 resolves the 100,000 to 150,000 bracket Yes.
- So exactly 100,000 pays Polymarket's upper bracket and Kalshi's No on the same strike. Unlikely, but the BLS prints in round thousands and 100,000 is the sort of number that happens.
- Revisions are handled asymmetrically. Polymarket's unemployment market says outright that "any revisions to the data after the first release will not count toward this market's resolution". The payroll market's rules do not carry that sentence, which matters because the June and July figures were revised up by a combined 55,000 in the August release.
- Both close before the release. Kalshi's contracts close at 08:29 Eastern, one minute before the data. There is no trading the print.
Both markets resolve on the BLS Employment Situation release, published at 08:30 Eastern on Friday October 2, with the unemployment market pointing specifically at the U-3 measure and the payroll market at the total nonfarm change. The BLS confirmed that date in the August release.
What the Print Does to the October Fed Decision
October 2 is the last jobs report before the Federal Open Market Committee meets on October 27 and 28, and the market currently expects that meeting to raise rates. Polymarket's October decision book, at $13.9 million the largest macro contract on the site, prices a 25 basis point increase at 61.5% and no change at 37.5%.
| October FOMC outcome | Polymarket price | Market volume |
|---|---|---|
| 25 bps increase | 61.5% | $3.52m |
| No change | 37.5% | $3.66m |
| 50+ bps increase | 1.1% | $2.14m |
| 25 bps decrease | 0.5% | $2.45m |
| 50+ bps decrease | 0.3% | $2.08m |
Polymarket "Fed Decision in October?", captured September 25, 2026, 16:30 UTC. Total event volume $13.9m, roughly 1,200 times the September payroll book.
That 61.5% is up from the 53.0% this site recorded on September 22 and the 56.4% on September 18, so hike odds have firmed by more than eight points in three days without a single new labour data point. The September jobs report is the first real test of that move.
Rough mapping, and it is asymmetric. A print above 150,000 with the unemployment rate at 4.1% or lower is a straightforward endorsement of the hike and takes that 61.5% into the seventies. A print in the 50,000 to 100,000 bracket the market expects changes very little, because it is already in the price. A negative print, or 4.3% unemployment, is the one outcome that genuinely reprices the meeting, and on today's odds that combination is a tail.
Worth noting which side of the mandate is doing the work here. The committee went 12-0 in September, so there is no dissent bloc to peel off. If the October meeting turns, it turns on the data, and the fuller argument for that is in Fed Rate Hike Odds October 2026.
What Could Break the 50k-100k Consensus
Not much scheduled data is left before October 2. The reference period is closed and the survey week is long past, so what remains is mostly about composition and mechanics.
- Revisions to June and July. The August release revised those two months up by a combined 55,000. Another upward revision pair would confirm the three-month average is nearer 71,000 than 31,000 and validate the market's anchor; a downward pair does the opposite, and Polymarket's 4.7% on 0 to 50,000 becomes indefensible.
- Federal workforce reduction. This is the drag Capital Economics cites for its 50,000 forecast. Government payroll losses land in the same total the contracts resolve on, so a large federal decline can offset a decent private month entirely.
- Participation. August's two-tenths rise is what kept unemployment at 4.1% despite 162,000 jobs. A repeat pushes the measured rate towards 4.2%; a reversal can pull it to 4.0% on a mediocre payroll number.
- Seasonal factors. September is a hard month for adjustment because of school-year hiring patterns, and the factors have been revised more than once this year. This is the commonest reason a well-modelled print still misses by 50,000.
- The September 30 funding deadline. A lapse in appropriations would delay or cancel the October 2 release outright. There is recent precedent: the 2025 shutdown cancelled a CPI release and broke a monthly series unbroken since 1921. Both books carry language for a release that never arrives, resolving on the last available month.
Where I land: the 50,000 to 100,000 bracket is a fair modal call and I would not fight it. The trade in this book, if there is one, is the 0 to 50,000 bucket, where a 15.3-point spread between two venues on the outcome that matches the twelve-month average is the sort of gap that usually closes towards the better-calibrated side. On unemployment the two books agree, the household survey is noisy, and there is nothing to do.
Frequently asked questions
What is the jobs report prediction for September 2026?
As of September 25, 2026, Polymarket's modal outcome for September nonfarm payrolls is 50,000 to 100,000 jobs at 35.5% normalised, with 100,000 to 150,000 at 32.7%. Kalshi's differenced ladder puts 31.0% on 50,000 to 100,000 and 37.5% above 100,000. The consensus forecast is 50,000. The report is released at 08:30 Eastern on Friday October 2, 2026.
When is the next jobs report released?
The September 2026 Employment Situation report is published by the Bureau of Labor Statistics on Friday October 2, 2026 at 08:30 Eastern. That date is confirmed in the August release. Both the Polymarket and Kalshi September payroll and unemployment contracts settle on figures in that release, and Kalshi's contracts stop trading at 08:29 Eastern.
What was the August 2026 jobs report?
Nonfarm payrolls rose 162,000 in August 2026, well above the 53,000 consensus, and the unemployment rate held at 4.1% with 7.0 million people unemployed. June was revised up 11,000 to 31,000 and July was revised up 44,000 to a 21,000 gain. Average hourly earnings rose 0.3% to $37.75, up 3.1% over the year, and labour force participation rose from 61.4% to 61.6%.
What unemployment rate do prediction markets forecast for September 2026?
Both venues price 4.1%, unchanged from August, as the single most likely outcome. Polymarket has it at 36.9% normalised and Kalshi's differenced ladder at 33.0%. The distribution leans upward: outcomes of 4.2% or higher total 38.6% on Polymarket against 24.6% for 4.0% or lower.
Why do Polymarket and Kalshi disagree on the September payroll number?
They agree closely at the bottom and diverge in one bucket. On the probability of an outright job loss they are within 0.3 of a point, at 11.8% and 11.5%. On a print between zero and 50,000 jobs Kalshi prices 20.0% and Polymarket 4.7%. The BLS puts average monthly job growth over the prior 12 months at 31,000, which falls inside that bucket, so Kalshi's number looks better anchored to the base rate.
How accurate have prediction markets been on the jobs report?
Mixed, and the recent misses ran one way. Going into the August 2026 report Kalshi priced roughly 50% and Polymarket 48% on clearing 50,000 jobs, and the print was 162,000. In April, Kalshi put only a 30% chance on a print above 100,000 and the first print was 115,000. Both misses were on the low side, which is worth remembering when reading a thin tail today.
What happens if the September jobs report comes in at exactly 100,000?
The two venues pay opposite ways. Kalshi's strikes are strictly greater, so "Above 100,000" needs 100,001 or more and exactly 100,000 resolves No. Polymarket's rules say a value falling exactly between two brackets resolves to the higher bracket, so exactly 100,000 resolves its 100,000 to 150,000 bracket Yes. Read both rulebooks before holding both sides.
What does the September jobs report mean for the October Fed decision?
It is the last labour reading before the October 27 to 28 FOMC meeting. Polymarket prices a 25 basis point increase at 61.5% and no change at 37.5%, up from 53.0% three days earlier. A print above 150,000 with unemployment at 4.1% or lower firms the hike case materially, while a negative print or a 4.3% jobless rate is the main outcome that would reprice the meeting.