10-Year Treasury Yield Forecast 2027: 5.09% Priced In

Every page ranking for 10 year treasury yield forecast 2027 hands you a number between 4.3% and 6% and leaves you to pick. The model sites give you a monthly table with no methodology. The bank notes give you one house's scenarios. The prediction-market pages quote a ladder from April and never tell you where the yield actually is.
The stakes are not abstract. The 10-year sets the 30-year mortgage, which printed at 7.28% on November 19, and the rate at which maturing federal debt is refinanced against an interest bill the CBO already puts at $1 trillion in 2026.
So I did something the roundups do not. I pulled the Treasury's own par yield curve for November, decomposed the 10-year into its real and inflation-compensation halves from the FRED TIPS series, extracted the forwards the curve already implies, and measured every published 2027 forecast against that forward instead of against each other.
The short version: the curve prices 5.09% for a year from now, and eight of the eleven published forecasts sit below it. Each one is an implicit claim that the term premium falls, and the term premium is at a level last seen in 2010.
10-Year Treasury Yield Forecast 2027: The Short Answer
Nine institutions and models have a 2027 number for the 10-year Treasury. They span 3.5% to 6.00%, a 250 basis point range. Strip out the Administration's budget assumption, which is a planning figure rather than a market call, and the remaining eight still span 170 basis points. Either way that is wider than the entire move from the February 2026 low to today, which is 107.
| Source | 2027 figure | Basis and date | Published |
|---|---|---|---|
| Congressional Budget Office baseline | 4.3% | Annual avg, holds to 2030 | Feb 2026 |
| Administration, FY2027 budget | 3.5% | Annual average | Apr 2026 |
| Goldman Sachs | 4.6% | End of 2027 | Nov 2026 |
| HSBC | 4.65% | Target, raised from 4.30% | Nov 2026 |
| WSJ economist survey, 71 respondents | 4.96% Jun, 4.78% Dec | Point forecast | Oct 2026 |
| Deutsche Bank | 4.95% Mar, 5.00% Jun, 5.05% Dec | Quarter-end | Nov 2026 |
| Financial Forecast Center model | 5.17% Jan, 4.82% May | Monthly avg, stops Jun 2027 | Nov 19, 2026 |
| ING | 5.25-5.50% Q1, then 4.50-4.75% | Path through 2027 | Nov 2026 |
| J.P. Morgan Wealth Management, base case | 5.00-5.50% | Mid-2027 | Oct 21, 2026 |
| J.P. Morgan Wealth Management, bear case | 5.50-6.00% | Mid-2027 | Oct 21, 2026 |
| J.P. Morgan Wealth Management, bull case | 4.25-4.75% | Mid-2027 | Oct 21, 2026 |
| Treasury curve, 1-year forward 9-year rate | 5.09% | Implied by the Nov 19, 2026 par curve | Live |
Every published 2027 forecast for the 10-year Treasury I could source. The J.P. Morgan scenarios are quoted from that firm's own October 21, 2026 publication; the CBO, Administration, Goldman, HSBC, Deutsche Bank, ING and WSJ figures are attributed to published reporting, because those pages refuse automated requests. The last row is not a forecast. It is a price.
Read the last row first. A forward rate is not an opinion about 2027, it is the rate at which you can lock in nine-year money starting a year from now, and it is 5.09%. The ten forecasts above it are each making a claim about how wrong that price is. Nobody in the list says so.
Where the 10-Year Treasury Yield Is Right Now
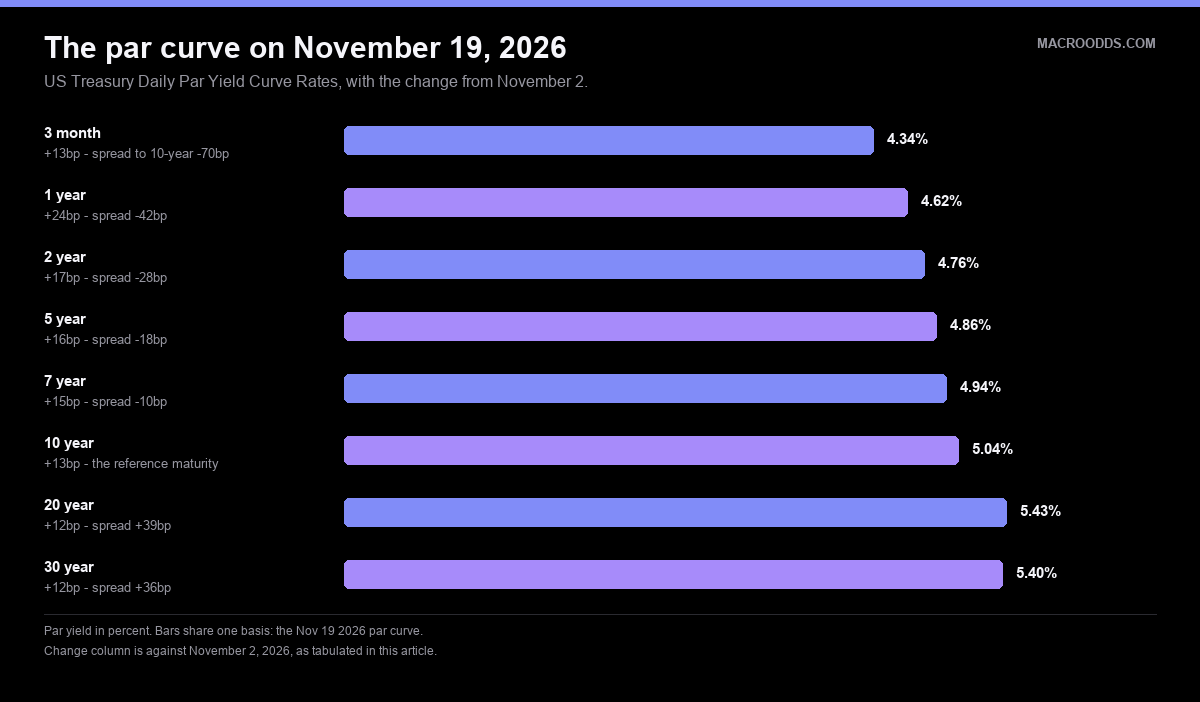
A 2027 forecast is a claim about distance travelled, so the starting point does the work. Here is the whole curve as the Treasury published it on November 19, 2026, which matters because that table is the resolution source for the live prediction markets further down this page.
| Maturity | Par yield, Nov 19 2026 | Change from Nov 2 | Spread to 10-year |
|---|---|---|---|
| 3 month | 4.34% | +13bp | -70bp |
| 1 year | 4.62% | +24bp | -42bp |
| 2 year | 4.76% | +17bp | -28bp |
| 5 year | 4.86% | +16bp | -18bp |
| 7 year | 4.94% | +15bp | -10bp |
| 10 year | 5.04% | +13bp | 0 |
| 20 year | 5.43% | +12bp | +39bp |
| 30 year | 5.40% | +12bp | +36bp |
US Treasury Daily Par Yield Curve Rates for November 19, 2026, against November 2, 2026. The 20-year sits 3 basis points above the 30-year, a hump that has held all month. Pulled from home.treasury.gov on November 20, 2026.
Two things about 5.04% are worth stating precisely rather than loosely. The last trading day before 2026 on which the 10-year closed at or above that level was July 19, 2007, which makes this a genuine 19-year high rather than the three-year high the same yield would have been called in 2023. And the 5% regime is young: of 221 trading days in 2026, only 31 have closed at or above 5.00%, the first of them on September 15.
The direction of travel matters more. The annual average has risen four years running: 3.96% in 2023, then 4.21%, 4.29%, and 4.55% so far in 2026, which itself ranged from a 3.97% low on February 27 to a 5.31% high on October 5. Our 10-year Treasury yield forecast for 2026 covers the first half of that move.
Why a 5% Ten-Year in 2026 Is Not the 5% of 2023
The last time the 10-year flirted with 5%, in October 2023, every commentator treated it as an inflation story. This time the same headline number has a completely different engine, and the TIPS market shows it in one table.
| Component | Oct 19, 2023 peak | Nov 18, 2026 | Change |
|---|---|---|---|
| 10-year nominal yield | 4.98% | 5.07% | +9bp |
| 10-year TIPS real yield | 2.49% | 2.88% | +39bp |
| 10-year inflation breakeven | 2.49% | 2.19% | -30bp |
| Kim-Wright 10-year term premium | 0.66pp | 0.99pp | +33bp |
| 2-year yield | 5.14% | 4.80% | -34bp |
| 2s10s curve | -16bp | +27bp | +43bp |
| Fed funds target, upper bound | 5.50% | 4.00% | -150bp |
FRED series DGS10, DFII10, T10YIE, THREEFYTP10, DGS2, T10Y2Y and DFEDTARU at the 2023 cycle peak and on November 18, 2026, the latest day all carry a value. The term premium row is dated November 13, 2026, the latest Kim-Wright observation.
In 2023 the 10-year reached 4.98% with the policy rate at 5.50% and the curve inverted by 16 basis points: the long end was dragged up by the front end, and the cure was obvious. That is not the situation now. The policy rate is 150 basis points lower, the curve slopes upward by 27 basis points, and the 10-year is nine basis points higher.
Split the yield in half and the asymmetry is stark. Inflation compensation has fallen 30 basis points since the 2023 peak, and the 10-year breakeven closed at 2.16% on November 19, its lowest of 2026 and five basis points above its 2003-to-2026 average of 2.11%. The bond market is not frightened of inflation. Our 2027 inflation outlook covers why the traded inflation market and the forecasters disagree by 64 basis points.
The real yield did all of it. At 2.88% the 10-year TIPS yield sits in the 99.5th percentile of 5,974 observations since January 2003. Only 32 of those days are at or above it: 18 are from the October and November 2008 collapse, and the other 14 are all from the last eight weeks.
The Term Premium Is Doing the Work, and It Is at a 16-Year High
A 10-year yield is the average policy rate investors expect over ten years plus the extra compensation they demand for locking money up that long. The second part is the term premium, and it is measurable rather than rhetorical.
| Year | Average Kim-Wright 10-year term premium | Year's high |
|---|---|---|
| 2020 | -0.52pp | -0.20pp |
| 2021 | -0.16pp | +0.02pp |
| 2022 | +0.31pp | +0.70pp |
| 2023 | +0.18pp | +0.66pp |
| 2024 | +0.33pp | +0.71pp |
| 2025 | +0.54pp | +0.81pp |
| 2026 to Nov 13 | +0.76pp | +1.10pp |
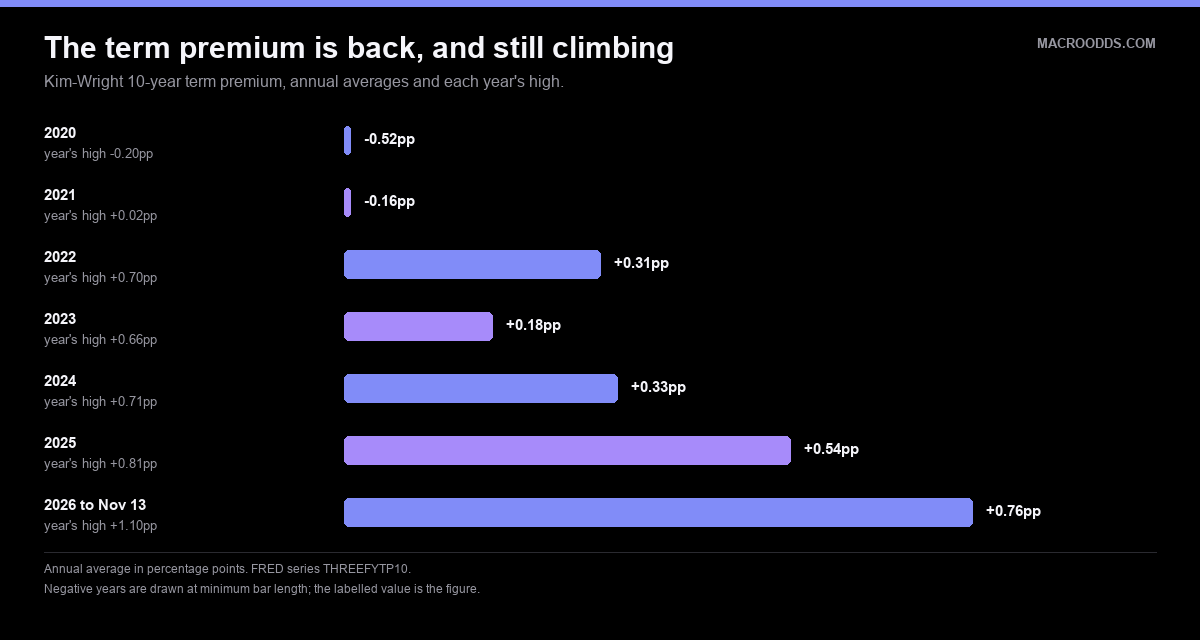
FRED series THREEFYTP10, the Kim-Wright 10-year term premium, annual averages and highs. The 2026 high of 1.0965 was set on October 5. Before 2026, the last observation at or above 1.00 was May 3, 2010.
Six years ago investors paid for the privilege of holding ten-year paper and the term premium was minus half a point. They now demand nearly a full point. That reversal, not the Fed, is the 2026 story, and it is what every forecast calling for 4.3% or 4.6% in 2027 implicitly undoes.
Do the subtraction and you get a number nobody publishes. On November 13 the 10-year was 5.15% and the term premium was 0.99, which leaves an expected average policy rate of 4.16% over the next decade. The effective fed funds rate is 3.88% today. The market is pricing a policy rate that averages 28 basis points above the current one for ten years.
Every 10-Year Treasury Yield Forecast for 2027, Measured Against the Forward
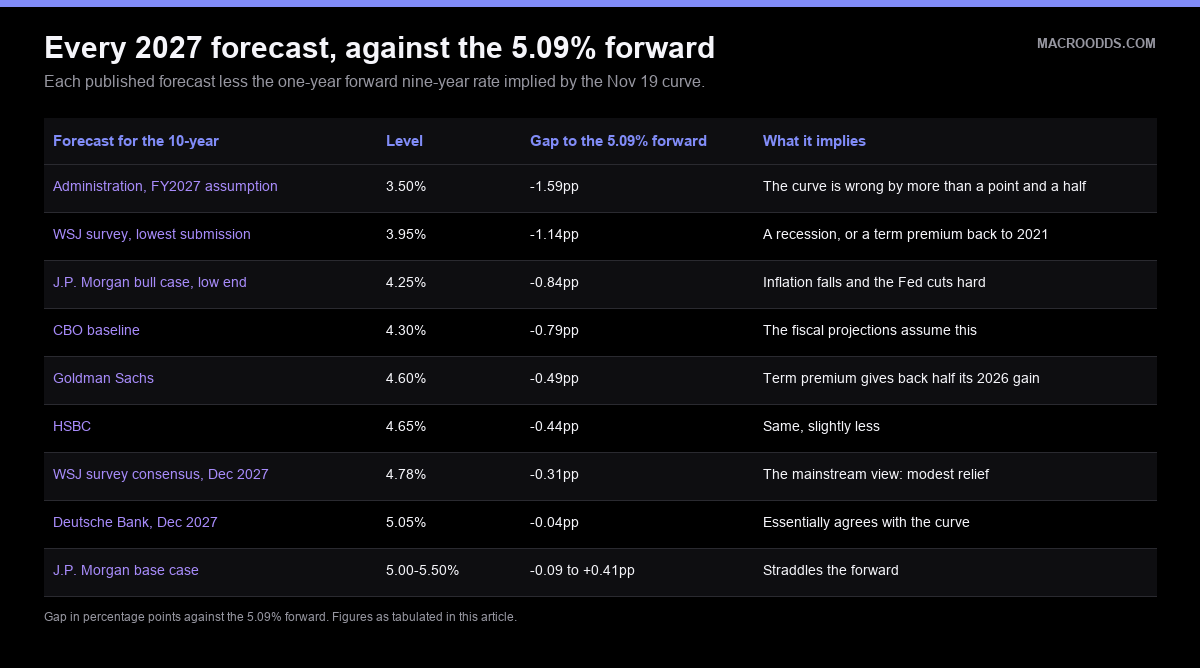
Here is the test the roundups never run. Strip the November 19 par curve into forwards and you get what the market charges for future money. The one-year forward nine-year rate is the market's own December 2027 ten-year yield: 5.09%.
Every forecast is therefore a quantifiable disagreement with a price. The third column below is the size of that disagreement in percentage points, which is the only number in this article that tells you how brave a given forecast is.
| Forecast for the 10-year | Level | Gap to the 5.09% forward | What it implies |
|---|---|---|---|
| Administration, FY2027 assumption | 3.50% | -1.59pp | The curve is wrong by more than a point and a half |
| WSJ survey, lowest submission | 3.95% | -1.14pp | A recession, or a term premium back to 2021 |
| J.P. Morgan bull case, low end | 4.25% | -0.84pp | Inflation falls and the Fed cuts hard |
| CBO baseline | 4.30% | -0.79pp | The fiscal projections assume this |
| Goldman Sachs | 4.60% | -0.49pp | Term premium gives back half its 2026 gain |
| HSBC | 4.65% | -0.44pp | Same, slightly less |
| WSJ survey consensus, Dec 2027 | 4.78% | -0.31pp | The mainstream view: modest relief |
| Deutsche Bank, Dec 2027 | 5.05% | -0.04pp | Essentially agrees with the curve |
| J.P. Morgan base case | 5.00-5.50% | -0.09 to +0.41pp | Straddles the forward |
| WSJ survey, highest submission | 5.63% | +0.54pp | Fiscal stress repriced |
| J.P. Morgan bear case | 5.50-6.00% | +0.41 to +0.91pp | A buyers' strike at the long end |
Each 2027 forecast less the 5.09% one-year forward nine-year rate implied by the November 19, 2026 Treasury par curve. The forward compounds the 1-year and 10-year par yields as if they were zero rates, an approximation worth a few basis points rather than an exact bootstrap. The WSJ survey's individual December 2027 submissions were reported as ranging from 3.95% to 5.63%.
Two readings jump out. Deutsche Bank is the only forecaster in the set that essentially agrees with the market, at four basis points below the forward, and it gets none of the attention that the 4.6% calls get. And the clustering is one-sided: eight of the eleven entries sit below the forward, and only that one is within ten basis points of it. That is what you would expect from a profession whose clients want to hear that borrowing costs come down.
The rest of the curve says it more emphatically. The five-year forward five-year rate is 5.22% and the ten-year forward ten-year rate is 5.82%, so the market prices long yields rising for as far out as it quotes. The one-year forward one-year rate of 4.90% is where the hikes show up.
The Real Yield Each 2027 Forecast Quietly Requires
A forecast of the nominal 10-year is secretly two forecasts: one for inflation compensation, one for the real yield. Hold the breakeven at its November 18 level of 2.19% and each 2027 call resolves into a real-yield requirement you can check against 23 years of data.
| Forecast | Nominal | Real yield it needs | Last time the real yield was there |
|---|---|---|---|
| Administration FY2027 | 3.50% | 1.31% | May 15, 2023 |
| WSJ lowest submission | 3.95% | 1.76% | March 2, 2026 |
| J.P. Morgan bull, low end | 4.25% | 2.06% | May 28, 2026 |
| CBO baseline | 4.30% | 2.11% | June 4, 2026 |
| Goldman Sachs | 4.60% | 2.41% | Late August 2026 |
| WSJ consensus | 4.78% | 2.59% | Early September 2026 |
| Deutsche Bank | 5.05% | 2.86% | November 12, 2026 |
| WSJ highest submission | 5.63% | 3.44% | Never in the TIPS era |
| J.P. Morgan bear, high end | 6.00% | 3.81% | Never in the TIPS era |
Each forecast's nominal yield less the November 18, 2026 breakeven of 2.19%, checked against FRED series DFII10 back to January 2, 2003. The all-time high in that series is 3.15%, set on November 21, 2008.
This is where the bear cases break. A 6.00% ten-year with breakevens unchanged requires a real yield of 3.81%, and the highest real yield in the entire history of the TIPS market is 3.15%. The bear case only works if inflation compensation does the lifting instead, and that needs a 10-year breakeven of 3.12%. The highest breakeven ever recorded is 3.02%, in April 2022. So the 6% call requires either an unprecedented real yield or an unprecedented breakeven.
The dovish end is more plausible but no less demanding. The CBO's 4.3% needs the real yield back to its June 2026 level, giving up nearly the whole 2026 repricing in thirteen months. That is a term-premium forecast dressed as an interest-rate forecast, and the CBO says so itself: its February 2026 outlook attributed the rise in its own projection to rising term premiums.
What You Can Actually Trade, and What You Cannot
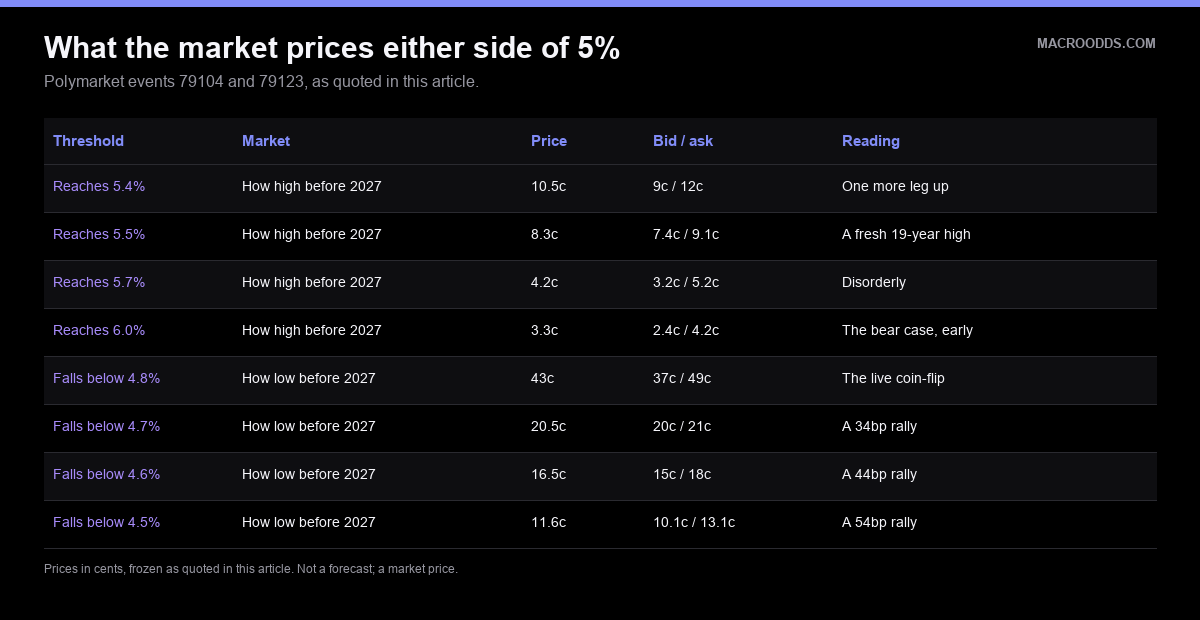
There is no 2027 Treasury-yield contract on either venue. Polymarket's two liquid 10-year markets both resolve on January 1, 2027, and they are touch markets: they pay if the yield reaches a level on any day in the window, not where it finishes.
| Threshold | Market | Price | Bid / ask | Reading |
|---|---|---|---|---|
| Reaches 5.4% | How high before 2027 | 10.5c | 9c / 12c | One more leg up |
| Reaches 5.5% | How high before 2027 | 8.3c | 7.4c / 9.1c | A fresh 19-year high |
| Reaches 5.7% | How high before 2027 | 4.2c | 3.2c / 5.2c | Disorderly |
| Reaches 6.0% | How high before 2027 | 3.3c | 2.4c / 4.2c | The bear case, early |
| Falls below 4.8% | How low before 2027 | 43c | 37c / 49c | The live coin-flip |
| Falls below 4.7% | How low before 2027 | 20.5c | 20c / 21c | A 34bp rally |
| Falls below 4.6% | How low before 2027 | 16.5c | 15c / 18c | A 44bp rally |
| Falls below 4.5% | How low before 2027 | 11.6c | 10.1c / 13.1c | A 54bp rally |
Polymarket events 79104 ($1.18m volume, $50,893 liquidity) and 79123 ($548k, $51,588), read on November 20, 2026. Both resolve off the Treasury's par curve '10 Yr' column for any date from November 11, 2025 to December 31, 2026. The 5.3% and below-4.9% legs already resolved yes, matching the 5.31% October high and 3.97% February low.
The 43 cents on falling below 4.8% is the most informative price on the board, and the 12-cent spread around it shows how little conviction sits behind it. The market gives a six-week rally of 24 basis points slightly worse than even odds, and anything larger fades fast. Our live Fed decision odds track the policy half of that question into the December 8-9 meeting.
Kalshi used to list the cleaner instrument and no longer does. Its `KXUSTYLD` par-yield-curve series carries nine events in total, the newest the 2-year at the end of Q3 2026; there is no 10-year event after Q2 2026 and no 2027 event of any maturity. That ladder resolved properly, 4.80% yes and 4.90% no, so the series worked. It simply stopped. Kalshi's API returns null rather than zero for volume on settled markets, so I make no claim about how much they traded.
What the Government's Own Forecast Assumes, and Why It Matters
The most consequential 2027 forecast in the table is not a bank's. It is the CBO's 4.3%, because that is the rate the federal budget baseline is built on, and it is 74 basis points below where the 10-year closed on November 19.
| Assumption | CBO baseline, Feb 2026 | Administration, FY2027 | Market, Nov 19 2026 |
|---|---|---|---|
| 10-year Treasury, 2026 | 4.1% | 3.7% | 4.55% average, 5.04% spot |
| 10-year Treasury, 2027 | 4.3% | 3.5% | 5.09% forward |
| 10-year Treasury, 2030 and beyond | 4.3% | n/a | 5.22% forward, but for 2031-36 |
| Fed policy direction | Cutting through end-2026 | n/a | ~3 hikes priced in 12 months |
| CPI inflation | 2.4% in 2027 | n/a | 2.16% breakeven, a 10-year average |
| Real GDP, 2027 | 1.8% | n/a | 2.3% (SPF, Nov 16 2026) |
CBO's February 2026 Budget and Economic Outlook and the Administration's FY2027 assumptions, against market pricing on November 19, 2026 and the Philadelphia Fed's Survey of Professional Forecasters of November 16, 2026. The CBO and Administration figures are attributed to published reporting; cbo.gov refuses automated requests.
Look at the fourth row. The February baseline assumed the Fed would keep cutting through the end of 2026. The Fed is at 3.75-4.00% and the one-year bill is pricing hikes. The policy assumption underneath the fiscal projections has reversed sign, and the rate assumption is three quarters of a point too low on the day.
The CBO has priced that error itself. Its September 24, 2026 analysis of rates one percentage point above baseline puts debt held by the public at 222% of GDP in fiscal 2056, some 47 percentage points above the extended baseline, with annual growth 0.1 points slower. Interest spending rises from $1 trillion in 2026 to $2.5 trillion in 2036 and $10.6 trillion in 2056. Our national debt explainer walks through the compounding.
That is the feedback loop the term premium is pricing. Higher yields raise the deficit, a larger deficit means more issuance, and more issuance at the long end raises the term premium again. A 4.3% assumption is not a neutral accounting convention when the market charges 5.09%.
What Would Actually Move the 10-Year in 2027
If you want to know whether the dovish forecasts are coming right, watch the two components rather than the headline. The level tells you nothing about which half moved.
- The 10-year TIPS real yield (FRED: DFII10), not the nominal. It is at 2.88%. A fall to 2.41% is Goldman's forecast arriving; a fall to 2.11% is the CBO's. Nothing in the nominal yield distinguishes those from a breakeven collapse.
- The Kim-Wright term premium (FRED: THREEFYTP10). A sustained move below 0.70 is the clearest signal the 2026 repricing is unwinding. It has risen in each of the last five calendar years.
- The 1-year par yield against the 3.88% effective fed funds rate. The 74 basis point gap is the hike premium. If it closes without the policy rate moving, the market has given up on hikes and the dovish 2027 calls get easier.
- The 20-year against the 30-year. The 20-year has been trading above the 30-year all month. That hump is an issuance and demand artefact at the long end, and it is where a buyers' strike would show up first.
- The December 8-9 FOMC and its projections. The last 2026 meeting, and it carries a Summary of Economic Projections. The first 2027 meeting is January 26-27; the Fed has published eight 2027 dates so far.
What would not move it much: a single CPI print, with the breakeven already at its 2026 low, or the December decision on its own. The 10-year is priced by duration risk and fiscal supply, not by the next 25 basis points of policy. Our 2027 Fed rate predictions and 2027 FOMC schedule cover the policy side; the release calendar carries every date above.
Frequently asked questions
What is the 10-year Treasury yield forecast for 2027?
Published forecasts span 3.5% to 6.00%. The WSJ's October 2026 survey of 71 economists is the mainstream view at 4.96% by June 2027 and 4.78% by December 2027. Goldman Sachs has 4.6% at end-2027, HSBC 4.65%, Deutsche Bank 5.05%, and the CBO's budget baseline assumes 4.3%. J.P. Morgan Wealth Management's October 2026 base case is 5.00% to 5.50% for mid-2027, with a 5.50% to 6.00% bear case.
What does the market itself price for the 10-year yield in 2027?
5.09%. Compounding the 1-year and 10-year par yields from the Treasury's November 19, 2026 curve gives a one-year forward nine-year rate of 5.09%, five basis points above the 5.04% spot. That is the market's own December 2027 10-year yield, and it is higher than eight of the eleven published forecasts.
Why is the 10-year Treasury yield so high in 2026?
Not inflation. The 10-year inflation breakeven closed at 2.16% on November 19, 2026, its lowest of the year and only five basis points above its 2003-to-2026 average. The 10-year TIPS real yield is 2.88%, in the 99.5th percentile of the TIPS era, and the Kim-Wright term premium reached 1.10 percentage points on October 5, a level last seen in 2010. The rise is compensation for duration and fiscal supply risk, not an inflation scare.
Is a 5% 10-year Treasury yield a 19-year high?
Yes, on this measure. The last trading day before 2026 on which the 10-year closed at or above 5.04% was July 19, 2007. The October 2023 scare peaked at 4.98% and never closed above 5.04%. The regime is new: only 31 of 221 trading days in 2026 have closed at or above 5.00%, the first on September 15, 2026.
Can you bet on the 2027 10-year Treasury yield on Polymarket or Kalshi?
Not as of November 20, 2026. Polymarket's two liquid 10-year markets, on how high and how low the yield goes before 2027, both resolve on January 1, 2027. Kalshi's KXUSTYLD par-yield-curve series lists nine events in total, the newest a 2-year contract for the end of Q3 2026, with no 10-year event after Q2 2026 and no 2027 event at any maturity.
Could the 10-year Treasury yield reach 6% in 2027?
It is priced at roughly 3 cents on Polymarket for any date before 2027, and the arithmetic for 2027 is demanding. With the breakeven held at its November 18 level of 2.19%, a 6.00% nominal yield needs a 3.81% real yield, and the highest real yield in 23 years of TIPS data is 3.15%, set on November 21, 2008. If the real yield instead stays at 2.88%, a 6.00% yield needs a 3.12% breakeven, and the record is 3.02% from April 2022.
Why is the CBO's 10-year Treasury forecast so much lower than the market's?
The CBO's February 2026 outlook projects 4.1% in 2026 rising to 4.3% in 2027 and holding there through 2030, and it assumed the Fed would keep cutting through the end of 2026. Neither held: the 10-year closed at 5.04% on November 19, 2026 and the 1-year bill is pricing hikes. CBO's own September 2026 analysis of rates one point above baseline puts debt at 222% of GDP by fiscal 2056.
What does a higher 10-year Treasury yield mean for mortgage rates in 2027?
The 30-year fixed mortgage tracks the 10-year plus a spread that has averaged roughly 2 to 2.3 percentage points in recent years. With the 10-year at 5.04% the 30-year fixed printed 7.28% on November 19, 2026. If the 10-year holds near the 5.09% forward through 2027, a mortgage rate below 7% needs the spread to compress rather than the Treasury to rally.
Sources
- US Treasury, Daily Par Yield Curve Rates, November 2026 (10-year 5.04% on November 19; the Polymarket resolution source)
- Federal Reserve, FOMC calendars (December 8-9, 2026 with projections; January 26-27 opens 2027)
- CRFB on CBO's September 24, 2026 higher-rate scenarios (debt 222% of GDP by 2056)
- Philadelphia Fed, Survey of Professional Forecasters Q4 2026 (November 16, 2026)
- Cleveland Fed, Inflation Expectations model