2027 FOMC Meeting Schedule: Every Date, Priced
Every page ranking for the 2027 FOMC meeting schedule gives you the same eight dates and stops there. I checked the three best of them this morning: one still labels the September 2026 meeting "upcoming", one hides the 2027 calendar inside an image, and the most recent market number any of them quotes is a secondhand CME figure for a meeting that has not happened yet.
The dates are the easy part, and the Fed publishes them for free. What nobody does is tell you that all eight 2027 meetings already have money on them. Kalshi runs a decision ladder on each one, Polymarket's book reaches January, and between them they describe a 2027 that looks nothing like the one the Fed's own dot plot describes.
So here is the calendar with the official dates, the projection meetings, the minutes release dates, and next to each one the price. I pulled both exchanges' full ladders, the September Summary of Economic Projections straight out of the PDF, the Treasury curve and the BLS release calendar for 2027, then did the arithmetic that turns a ladder into a rate.
The 2027 FOMC Meeting Schedule, Every Date
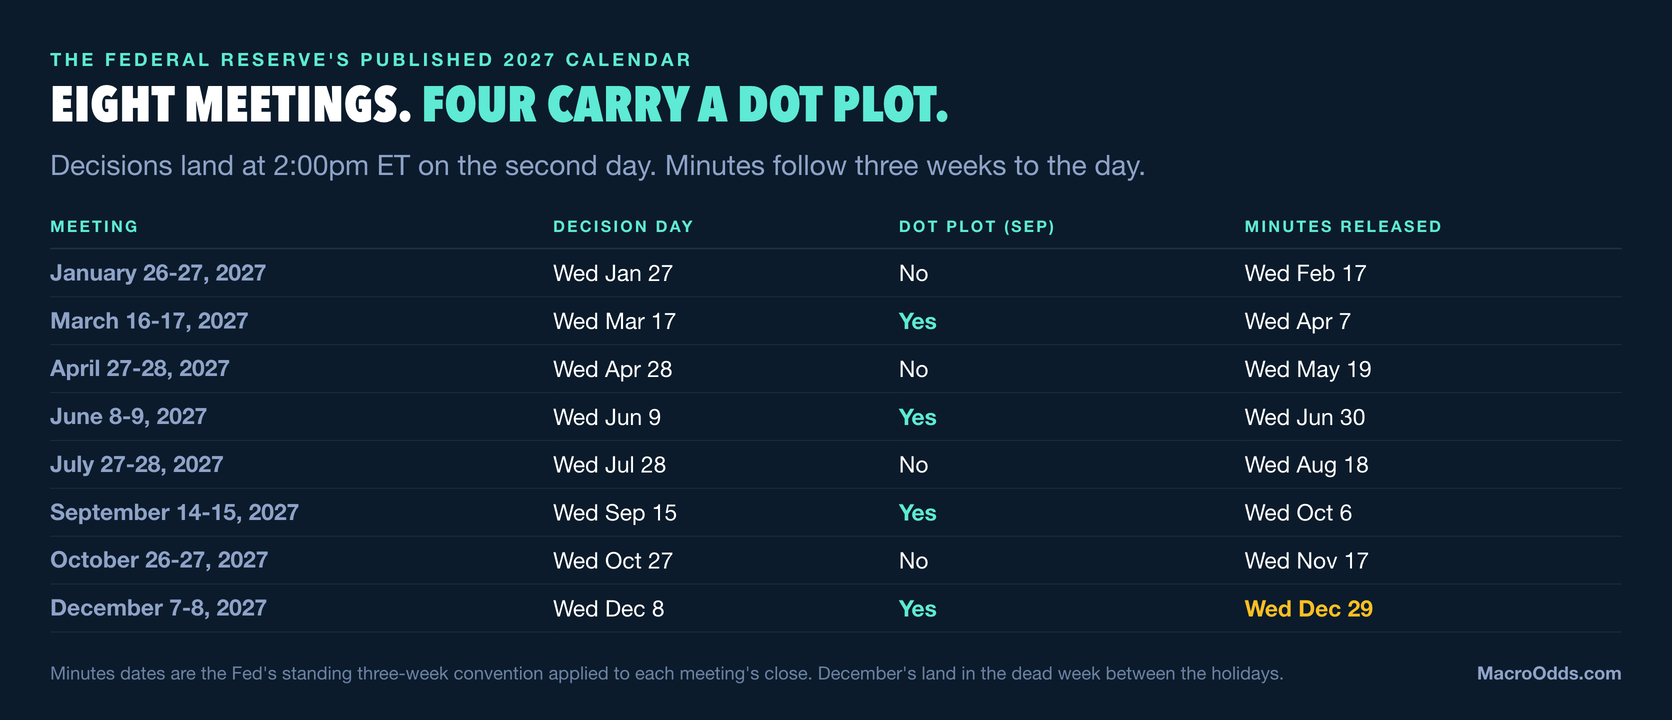
The Federal Reserve publishes its calendar two years out. Each meeting runs two days, the decision lands at 2:00pm ET on the second day, and any rate change takes effect the following morning. Minutes follow three weeks to the day after the close of each meeting, also at 2:00pm ET.
| Meeting | Decision day | Dot plot (SEP) | Minutes released |
|---|---|---|---|
| January 26-27, 2027 | Wed Jan 27 | No | Wed Feb 17 |
| March 16-17, 2027 | Wed Mar 17 | Yes | Wed Apr 7 |
| April 27-28, 2027 | Wed Apr 28 | No | Wed May 19 |
| June 8-9, 2027 | Wed Jun 9 | Yes | Wed Jun 30 |
| July 27-28, 2027 | Wed Jul 28 | No | Wed Aug 18 |
| September 14-15, 2027 | Wed Sep 15 | Yes | Wed Oct 6 |
| October 26-27, 2027 | Wed Oct 27 | No | Wed Nov 17 |
| December 7-8, 2027 | Wed Dec 8 | Yes | Wed Dec 29 |
Meeting dates from the Federal Reserve's FOMC calendar page. Minutes dates are the Fed's standing three-week convention applied to each meeting's close, not separately published dates.
Two details are worth holding on to. The December 2027 minutes land on December 29, in the dead week between the holidays, which is the thinnest liquidity of the year for anything rates-related. And the Fed has already pencilled in the first meeting of 2028 for January 25-26, so the 2027 December decision is seven weeks from the next chance to change course.
If you want the same table for the year we are actually in, including what each 2026 meeting decided, that lives in our 2026 FOMC meeting schedule. The remaining 2026 dates are October 27-28 and December 8-9.
What the Market Already Prices for January 2027
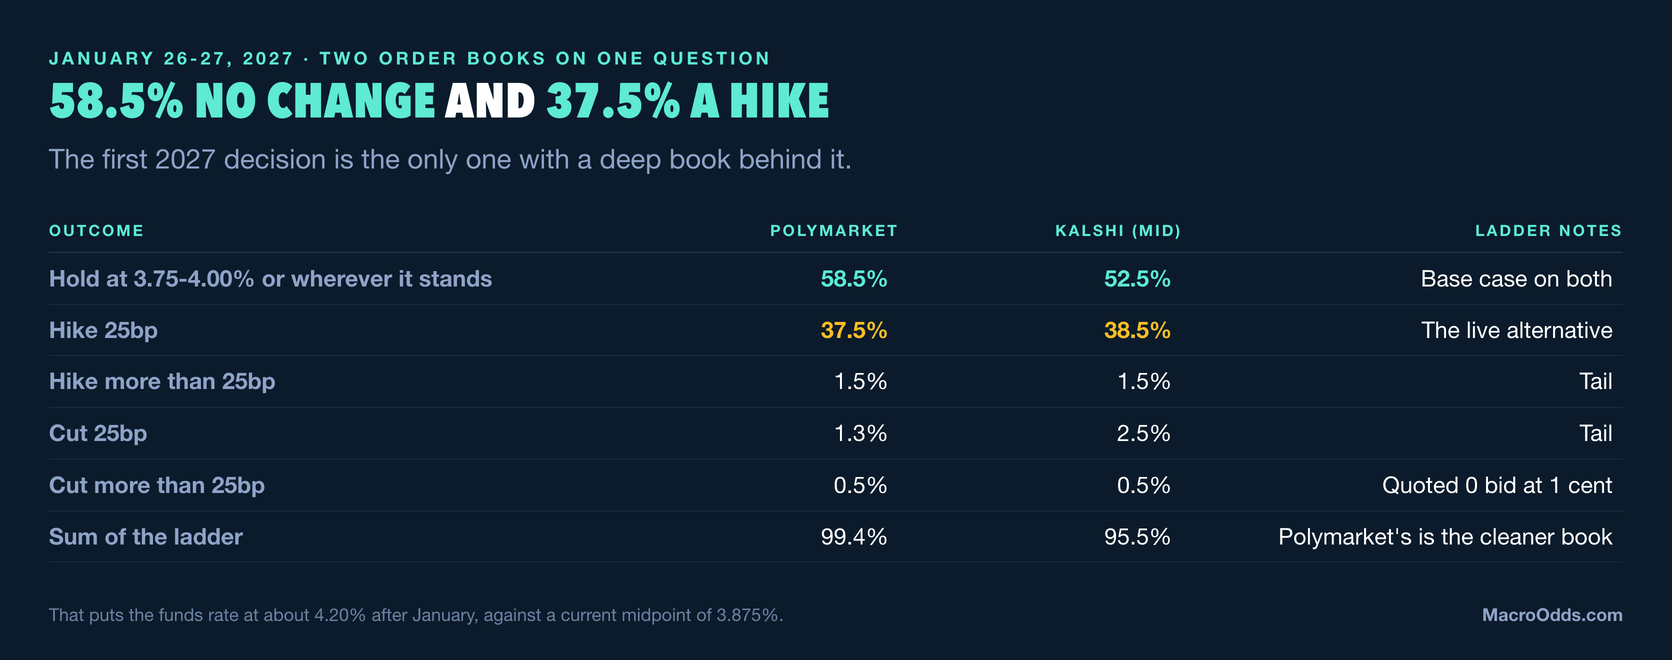
The January 26-27 meeting is the only 2027 date with a genuinely liquid two-venue market, and it is the most interesting number on this page. Both books agree the base case is a hold, and both put better than a one-in-three chance on another quarter-point hike.
| Outcome | Polymarket | Kalshi (mid) | Ladder notes |
|---|---|---|---|
| Hold at 3.75-4.00% or wherever it stands | 58.5% | 52.5% | Base case on both |
| Hike 25bp | 37.5% | 38.5% | The live alternative |
| Hike more than 25bp | 1.5% | 1.5% | Tail |
| Cut 25bp | 1.3% | 2.5% | Tail |
| Cut more than 25bp | 0.5% | 0.5% | Quoted 0 bid at 1 cent |
| Sum of the ladder | 99.4% | 95.5% | Polymarket's is the cleaner book |
Polymarket event 770451 and Kalshi series KXFEDDECISION segment 27JAN, both pulled October 20, 2026. Kalshi figures are bid-ask midpoints; every main leg quoted a one-cent spread.
Turn that into a rate and the two venues land in the same place. Weighting each outcome by its probability gives +9.6 basis points of expected tightening at January from Polymarket and +10.0 basis points from Kalshi. Stack that on top of what the two books price for the October 28 and December 9 decisions this year and the funds rate midpoint comes out at roughly 4.20% once January is done, from 3.875% today.
The honest caveat on that number: the "more than 25bp" legs have to be weighted at something, and I used 50 basis points for both the hike and the cut tail. They carry 1.5% and 0.5%, so the choice moves the answer by less than a basis point. The arithmetic for the 2026 half of that path is worked through in our December rate hike odds piece.
The Whole 2027 Path, Meeting by Meeting
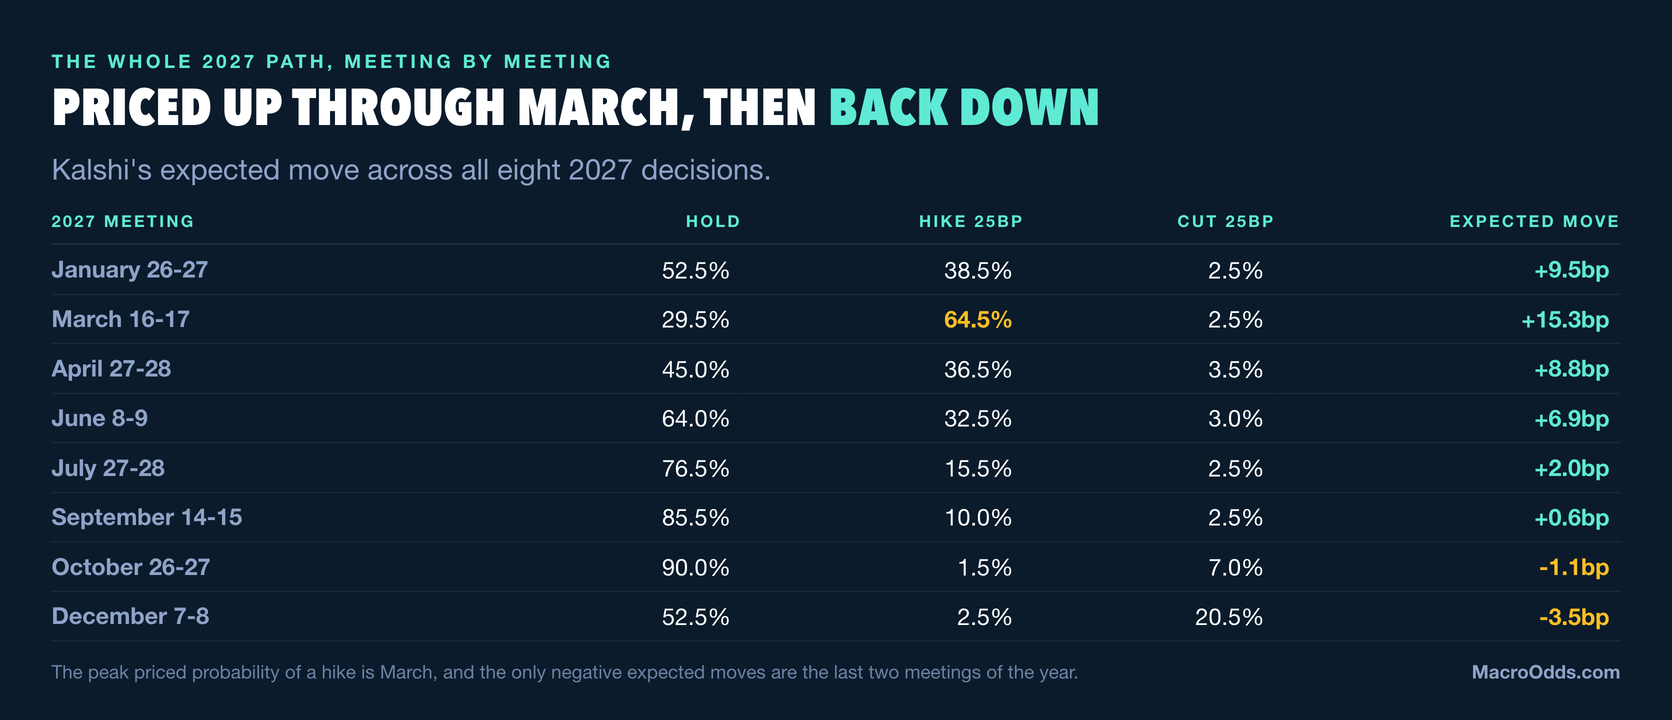
Kalshi is the only venue with a book on all eight 2027 meetings, so this table is its ladder. Read the hold column first: it is the committee's default, and the shape of how it moves through the year is the story.
| 2027 meeting | Hold | Hike 25bp | Cut 25bp | Expected move |
|---|---|---|---|---|
| January 26-27 | 52.5% | 38.5% | 2.5% | +9.5bp |
| March 16-17 | 29.5% | 64.5% | 2.5% | +15.3bp |
| April 27-28 | 45.0% | 36.5% | 3.5% | +8.8bp |
| June 8-9 | 64.0% | 32.5% | 3.0% | +6.9bp |
| July 27-28 | 76.5% | 15.5% | 2.5% | +2.0bp |
| September 14-15 | 85.5% | 10.0% | 2.5% | +0.6bp |
| October 26-27 | 90.0% | 1.5% | 7.0% | -1.1bp |
| December 7-8 | 52.5% | 2.5% | 20.5% | -3.5bp |
Kalshi KXFEDDECISION 2027 segments, bid-ask midpoints, October 20, 2026. Expected move weights each leg by its midpoint, with the "more than 25bp" legs at 50bp. Columns do not sum to 100% because the tails are omitted and several ladders do not sum to 1.
The shape is clean even where the levels are not. Tightening is front-loaded into the first half: January and March carry almost all of it, April and June carry the rest, and by September the hold leg is at 85.5%. Then the ladder turns over. October 2027 prices a cut at 7.0% against a hike at 1.5%, the first meeting all year where the cut leg is the bigger one, and December 2027 prices a cut at 20.5%.
Chaining those expected moves gives a midpoint peaking near 4.54% around September 2027 and easing back toward 4.49% by December. I am quoting that figure once and then telling you not to lean on it, because the next section is about why a chain of eight midpoints on books this thin is a direction rather than a forecast.
Where the Market Disagrees With the Fed's Own Dots
The committee published its own 2027 view on September 16, and it is not the market's view. Here is Table 1 of the Summary of Economic Projections, straight from the PDF, next to what the exchanges price.
| Measure | 2026 | 2027 | 2028 | Longer run |
|---|---|---|---|---|
| Median funds rate, September 2026 SEP | 4.1% | 4.1% | 3.9% | 3.2% |
| Median funds rate, June 2026 SEP | 3.8% | 3.6% | 3.4% | 3.1% |
| Central tendency, September 2026 | 4.1-4.4% | 3.6-4.4% | 3.1-4.1% | 3.0-3.6% |
| Full range of participants | 3.9-4.4% | 3.1-4.4% | 3.1-4.1% | 2.9-3.9% |
| Market-implied midpoint (both venues) | 4.10-4.11% | 4.20% after January | n/a | n/a |
| Median core PCE inflation | 3.4% | 2.5% | 2.2% | n/a |
Federal Reserve Summary of Economic Projections, September 16, 2026, Table 1. Market-implied figures are my own calculation from the Polymarket and Kalshi ladders on October 20, 2026.
Read the first two rows together. In June the committee's median had the funds rate at 3.6% at the end of 2027. By September that had become 4.1%, a 50 basis point revision in one quarter, and the 2027 median now sits exactly level with the 2026 median. On the committee's own arithmetic, 2027 is a year in which nothing happens.
The market disagrees on the route, not the direction. It has the funds rate through the committee's end-2027 median in January, eleven months early, and then prices meetings that drift back the other way from October. One of two things is true: either the dots move up again in December, or the market is paying for a hiking cycle that gets partly unwound inside the same year. The December 8-9 projections are the next time we find out, and our September dot plot breakdown explains how to read the distribution behind that median.
How Much a 2027 Price Is Actually Worth
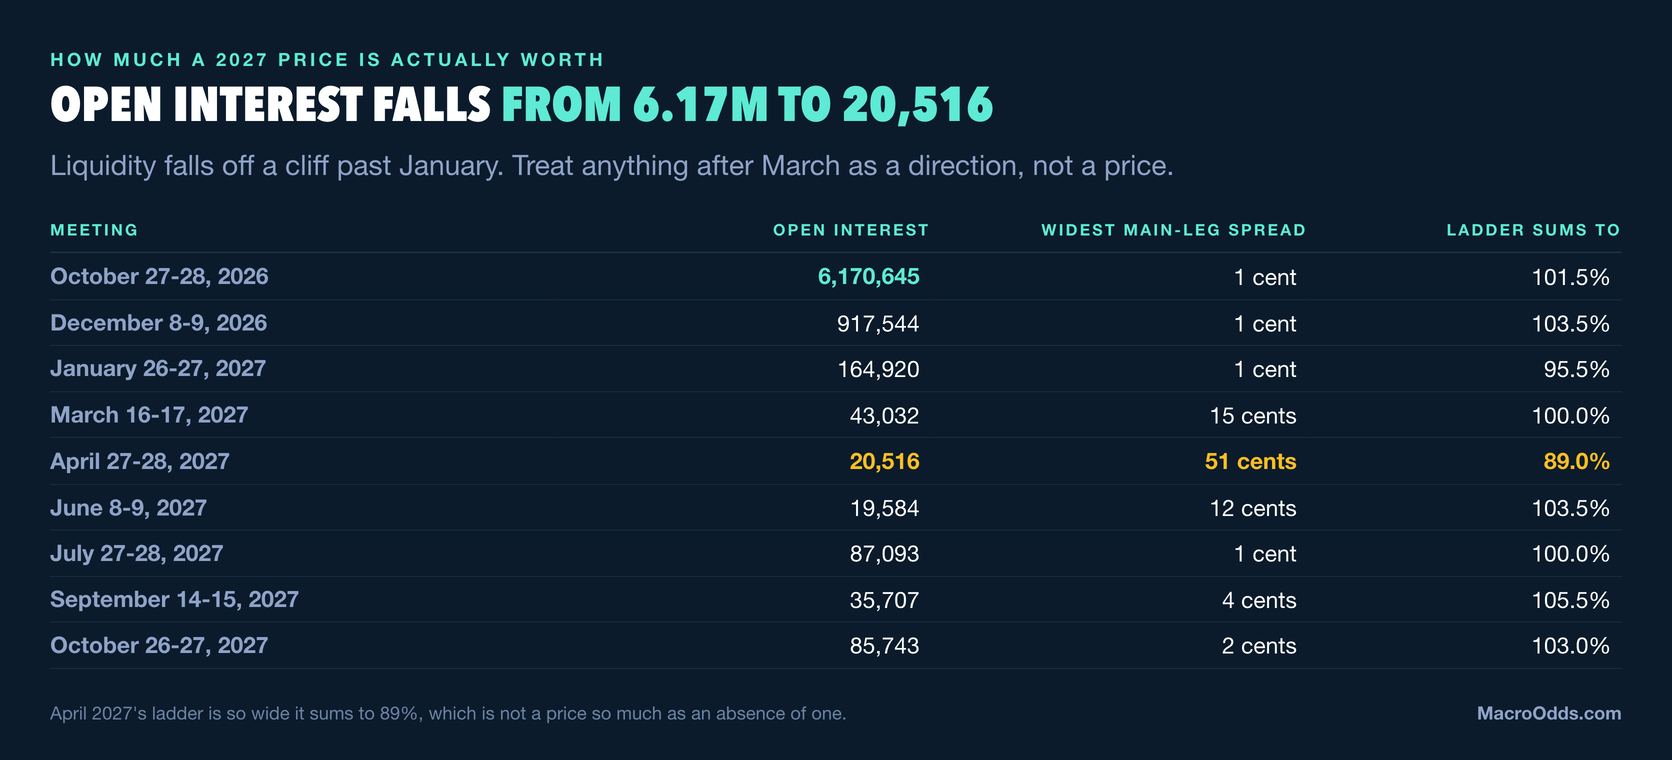
A price with nothing behind it is a quote, not a probability. This is the part every schedule page skips, and it is the reason I will not give you a single confident number for December 2027.
| Meeting | Open interest | Widest main-leg spread | Ladder sums to |
|---|---|---|---|
| October 27-28, 2026 | 6,170,645 | 1 cent | 101.5% |
| December 8-9, 2026 | 917,544 | 1 cent | 103.5% |
| January 26-27, 2027 | 164,920 | 1 cent | 95.5% |
| March 16-17, 2027 | 43,032 | 15 cents | 100.0% |
| April 27-28, 2027 | 20,516 | 51 cents | 89.0% |
| June 8-9, 2027 | 19,584 | 12 cents | 103.5% |
| July 27-28, 2027 | 87,093 | 1 cent | 100.0% |
| September 14-15, 2027 | 35,707 | 4 cents | 105.5% |
| October 26-27, 2027 | 85,743 | 2 cents | 103.0% |
| December 7-8, 2027 | 12,155 | 33 cents | 78.5% |
Kalshi open interest and quoted spreads, October 20, 2026, summed across each meeting's five legs. A ladder that sums well away from 100% is telling you the midpoints are not probabilities.
Open interest falls by a factor of 37 between October 2026 and January 2027, and by another factor of four into March. April 2027 is the worst of it: 20,516 contracts, a 51 cent spread on the hike leg, and a ladder summing to 89%. A midpoint on a book like that is the average of two prices nobody is trading at.
Three 2027 meetings do hold up: January, July and October all quote one or two cent spreads with ladders within a few points of 100%. That is a usable price. Everything between them is a direction, and December 2027 at 78.5% is not even that.
The bond market gives an independent read on the same question, and it agrees with the hawkish half. The 2-year Treasury yielded 4.77% on October 19, roughly 90 basis points above today's funds rate midpoint, and a 2-year note cannot out-yield the overnight rate by that much unless the market expects the overnight rate to rise. The 10-year sat at 5.15% and the 3-month bill at 4.27%. Directional, but it points the same way as the first half of the Kalshi ladder.
Which Inflation Print Each 2027 Meeting Sees
This is the table I actually wanted when I started, and no competitor has it. The BLS has already published its 2027 CPI release calendar, so you can line the two schedules up and see which committee meetings are flying with stale data.
| 2027 meeting | Last CPI before it | Days before | Next CPI | Days after |
|---|---|---|---|---|
| January 26-27 | December 2026, Jan 13 | 14 | January, Feb 11 | 15 |
| March 16-17 | February, Mar 10 | 7 | March, Apr 13 | 27 |
| April 27-28 | March, Apr 13 | 15 | April, May 12 | 14 |
| June 8-9 (SEP) | April, May 12 | 28 | May, Jun 10 | 1 |
| July 27-28 | June, Jul 14 | 14 | July, Aug 11 | 14 |
| September 14-15 (SEP) | August, Sep 14 | 1 | September, Oct 14 | 29 |
| October 26-27 | September, Oct 14 | 13 | October, Nov 10 | 14 |
| December 7-8 (SEP) | October, Nov 10 | 28 | November, Dec 10 | 2 |
FOMC decision days against the BLS Consumer Price Index release schedule for 2027. Days are counted from the release to the decision day.
Two of the four projection meetings are badly placed. The June 8-9 meeting publishes a dot plot one day before the May CPI report, and the December 7-8 meeting publishes one two days before the November report. In both cases the committee commits a full set of 2028 projections to paper and then watches a fresh inflation print land before the ink is dry.
September 14-15 is the mirror image. August CPI is released at 8:30am ET on September 14, which is the morning the meeting opens, so that committee gets the freshest data of any meeting in the year and gets it in the room. If you are picking one 2027 meeting to expect a surprise from, that asymmetry is where I would start.
What Changed in the 2027 FOMC Meeting Schedule Versus 2026
The calendar is not a copy of this year's with the dates shifted. One meeting moves by more than a week, and it is the one that matters most.
| Slot | 2026 | 2027 | Gap from previous meeting |
|---|---|---|---|
| Meeting 1 | January 27-28 | January 26-27 | 7 weeks both years |
| Meeting 2 (SEP) | March 17-18 | March 16-17 | 7 weeks both years |
| Meeting 3 | April 28-29 | April 27-28 | 6 weeks both years |
| Meeting 4 (SEP) | June 16-17 | June 8-9 | 7 weeks in 2026, 6 in 2027 |
| Meeting 5 | July 28-29 | July 27-28 | 6 weeks in 2026, 7 in 2027 |
| Meeting 6 (SEP) | September 15-16 | September 14-15 | 7 weeks both years |
| Meeting 7 | October 27-28 | October 26-27 | 6 weeks both years |
| Meeting 8 (SEP) | December 8-9 | December 7-8 | 6 weeks both years |
The 2026 and 2027 FOMC calendars side by side, from the Federal Reserve's calendar page. Gaps are measured between decision days.
Seven of the eight slots move by one day. The June meeting moves by eight days, from June 16-17 to June 8-9, which pulls the mid-year dot plot back before the May inflation print instead of after it. That single change is why the June row in the CPI table above reads one day rather than the comfortable two weeks it had in 2026.
The Dates Are Tentative, and What Would Move Them
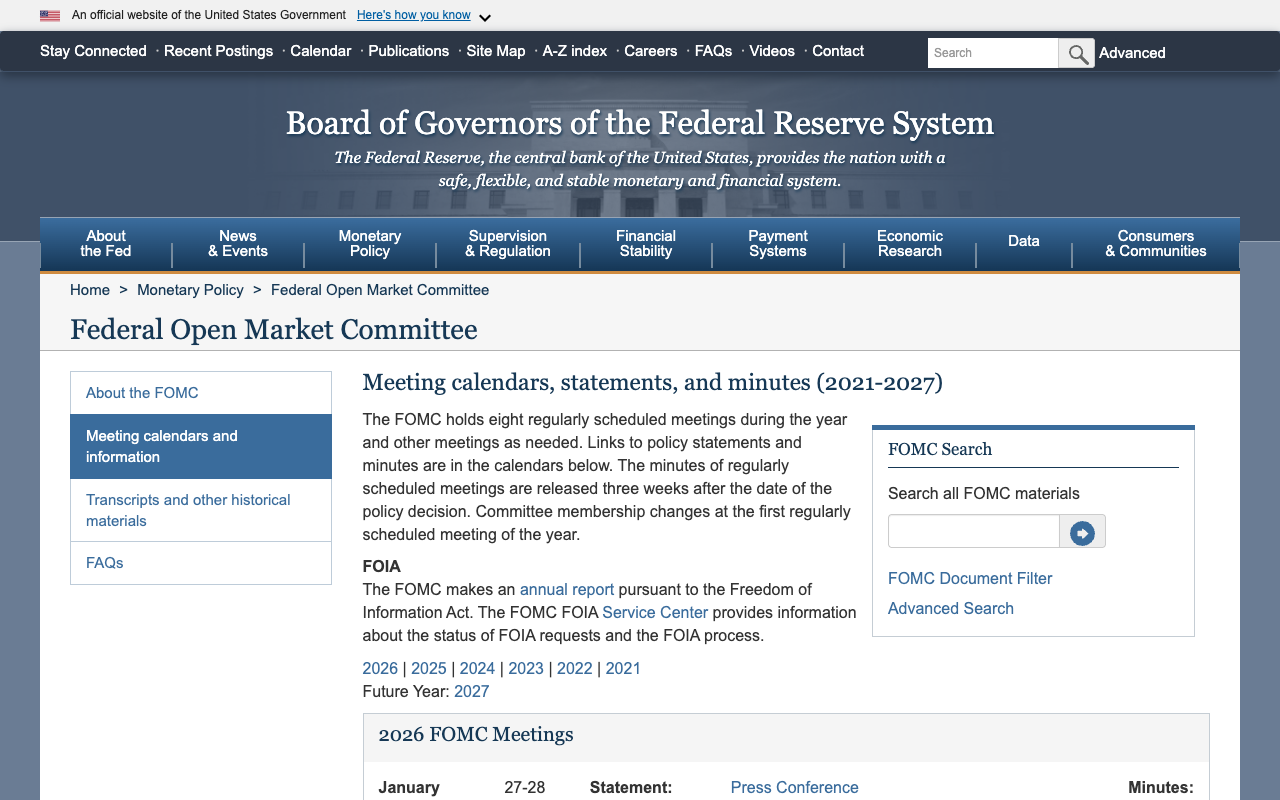
The Fed's own calendar page carries one line everybody copies and nobody explains: each meeting date is tentative until confirmed at the meeting immediately preceding it. In practice the scheduled dates almost never move. What does happen is that meetings get added.
The committee can convene an unscheduled meeting whenever it wants, and it has done so in every genuine crisis, usually by videoconference and sometimes with a rate decision attached. Prediction markets handle this badly, because a Kalshi or Polymarket contract is written on the scheduled meeting. An intermeeting move resolves nothing on the January ladder, which is one more reason the far-dated prices deserve the discount the previous section gave them.
The other thing that will not move is who runs the meetings. Kevin Warsh chairs all eight 2027 decisions, and the committee's first move under him was a hike, which is not what the market expected when he was nominated. Our next Fed chair piece covers how that market priced the appointment and what it got wrong.
How I Would Track the 2027 Meetings
A schedule is only useful if you know what to do on the day. This is the routine I run, in order, and it takes about ten minutes per meeting.
- Check the ladder sum first, not the headline leg. If the five legs add to 89% or 105%, the midpoints are not probabilities and nothing below this step is worth doing.
- Read the hold leg, not the hike leg. The hold is the default outcome, and its level tells you how much of a surprise the market is pricing without you having to add up tails.
- Compare both venues. Polymarket and Kalshi disagreed by 6 points on January's hold when I pulled them, which is a bigger gap than either book's spread and is information in itself.
- Convert the ladder to basis points. A probability is hard to hold against a dot plot; an expected move in basis points is not.
- On SEP meetings, check the dot distribution, not just the median. The 2027 central tendency spans 3.6% to 4.4%, so the median is hiding an 80 basis point argument.
- Check what CPI print the committee has just seen, using the table above. A meeting working off four-week-old inflation data is a meeting more likely to wait.
The 2026 calendar still has two decisions left on it, October 27-28 and December 8-9, and the December one publishes the projections that will either validate or break everything on this page. For the current target range and the whole administered-rate corridor underneath it, start with our Federal Reserve interest rates explainer.
Frequently asked questions
When are the 2027 FOMC meetings?
There are eight: January 26-27, March 16-17, April 27-28, June 8-9, July 27-28, September 14-15, October 26-27 and December 7-8, 2027. Each is a two-day meeting with the decision announced at 2:00pm ET on the second day. The Federal Reserve has also pencilled in January 25-26, 2028 for the first meeting of the following year.
Which 2027 FOMC meetings have a dot plot?
March, June, September and December. Those four publish the Summary of Economic Projections, which includes the dot plot of each participant's view of the appropriate federal funds rate. The January, April, July and October meetings issue a statement and hold a press conference but publish no projections.
What does the market expect the Fed to do in January 2027?
Hold, but not by much. Polymarket prices 58.5% no change against 37.5% for a quarter-point hike, and Kalshi's midpoints are 52.5% and 38.5%. Weighted out, both books imply about 10 basis points of expected tightening at that meeting, which would put the funds rate midpoint near 4.20% from 3.875% today.
Can you bet on 2027 Fed meetings yet?
Yes. Kalshi lists a decision ladder on all eight 2027 meetings and Polymarket's market reaches the January 26-27 meeting with about $662,000 of volume. Liquidity thins quickly after that: open interest is 164,920 contracts on January 2027 against 6.17 million on the October 2026 decision, and the April 2027 book quoted a 51 cent spread when I pulled it.
Does the market agree with the Fed's 2027 dot plot?
No. The September 2026 projections put the median funds rate at 4.1% at the end of 2027, level with the 2026 median, so the committee is projecting a year of no net change. The market has the rate through 4.1% at the January meeting and tilts toward further hikes into mid-2027 before leaning the other way in the autumn.
When are the 2027 FOMC minutes released?
Three weeks after each meeting closes, at 2:00pm ET, which puts them on February 17, April 7, May 19, June 30, August 18, October 6, November 17 and December 29, 2027. Those are derived from the Fed's standing convention rather than separately published dates, so confirm each one against the Fed's calendar page nearer the time.
Why is the June 2027 meeting earlier than usual?
The June 2027 meeting falls on June 8-9, eight days earlier than June 2026's June 16-17. That matters because the May CPI report is scheduled for June 10, 2027, one day after the decision, so the committee publishes a full set of projections and then immediately sees a fresh inflation print.
Can the FOMC change the 2027 schedule?
The Fed says each date is tentative until confirmed at the preceding meeting, but scheduled dates rarely move. The real variable is unscheduled meetings, which the committee can call at any time and has in past crises. Prediction-market contracts are written on the scheduled meetings, so an intermeeting decision does not resolve them.
Sources
- Federal Reserve, FOMC meeting calendars, 2026 and 2027
- Federal Reserve, Summary of Economic Projections, September 16, 2026 (Table 1)
- Bureau of Labor Statistics, Consumer Price Index release schedule
- Kalshi, KXFEDDECISION open markets (public API)
- Polymarket, Fed Decision in January 2027
- US Treasury, daily Treasury par yield curve rates
- Federal Reserve Bank of New York, reference rates (EFFR)