Federal Reserve Interest Rates 2026: 3.75-4.00%

Search for the Federal Reserve and interest rates and the first page will hand you at least three different answers, all of them wrong. The best explainer on that page, from a think tank that actually understands the plumbing, quotes a target range of 4.25-4.50% and an interest-on-reserves rate of 4.40%. Those were the right numbers in August 2025. Since then the Fed cut three times and hiked once.
Here are the numbers. The federal funds target range is 3.75% to 4.00%, effective September 17, 2026. Interest on reserve balances is 3.90%, the overnight reverse repo rate is 3.75%, and the discount window is 4.00%. The effective federal funds rate has printed 3.88% every single session since, on about $118 billion a night.
What nobody ranking for this term does is tell you what happens next using money rather than opinion. Two live order books cover the October 28 decision. I pulled the September implementation note, the New York Fed's reference rates, the Treasury curve, both exchanges' full decision ladders and the Fed's own September projections, then did the arithmetic that turns a set of prices into one number you can hold against the dot plot.
Where Federal Reserve Interest Rates Stand Today
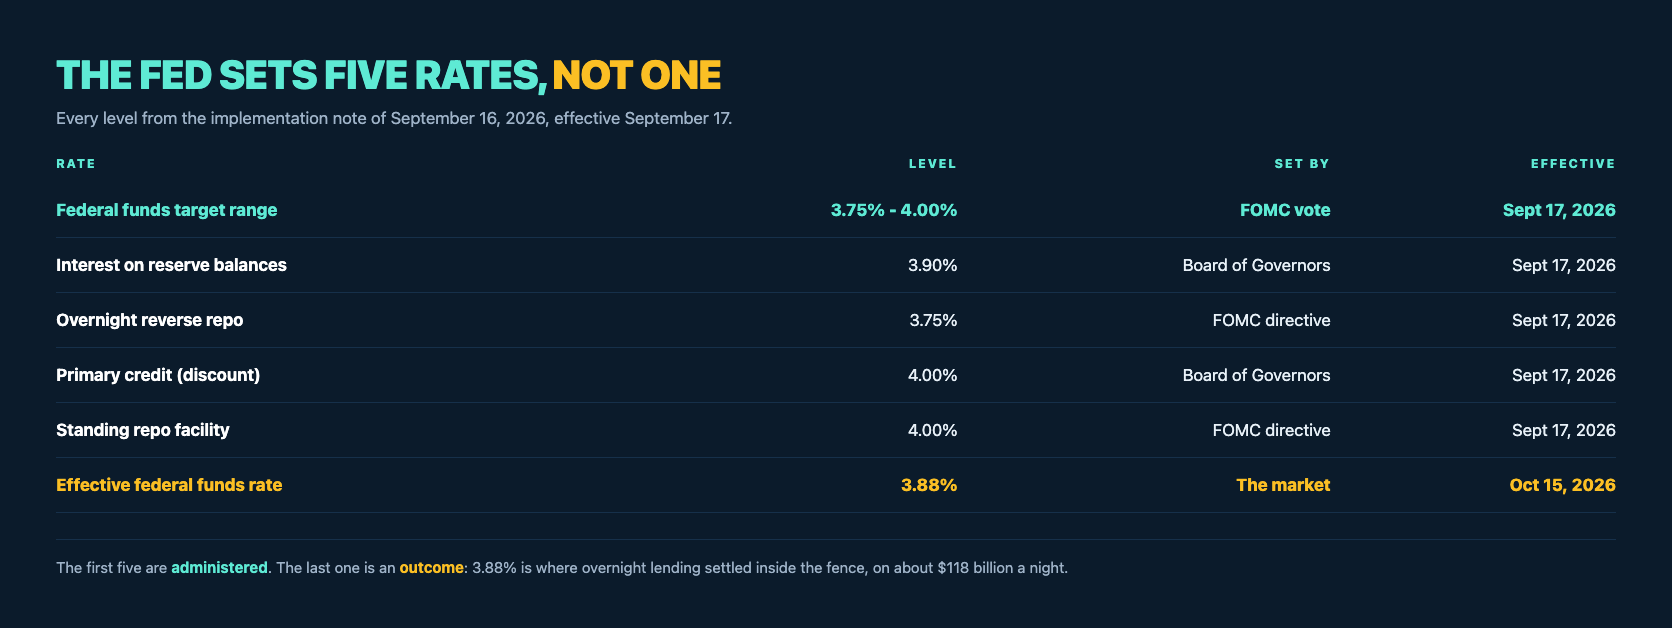
The phrase "the Fed raised interest rates" compresses five separate decisions into one. Below is the whole corridor, every level from the implementation note published alongside the September 16 statement.
| Rate | Level | Set by | Effective |
|---|---|---|---|
| Federal funds target range | 3.75% - 4.00% | FOMC vote | Sept 17, 2026 |
| Interest on reserve balances (IORB) | 3.90% | Board of Governors | Sept 17, 2026 |
| Overnight reverse repo (ON RRP) | 3.75% | FOMC directive | Sept 17, 2026 |
| Primary credit (discount) rate | 4.00% | Board of Governors | Sept 17, 2026 |
| Standing repo facility | 4.00% | FOMC directive | Sept 17, 2026 |
| Effective federal funds rate (EFFR) | 3.88% | The market | Oct 15, 2026 |
Federal Reserve implementation note of September 16, 2026, and the New York Fed's reference rates for October 15, 2026. The first five are administered. The last one is an outcome.
Note the dates. The statement came out on Wednesday September 16; every rate took effect on September 17. The Fed's own historical table of target range changes lists that move under September 17, one day after the meeting ended, because it records the effective date rather than the announcement. That single-day offset is why two sources can give different dates for the same decision and both be right.
The gap between the 3.75-4.00% range and the 3.88% rate the market actually produced is the point of the whole apparatus. The FOMC does not have a lever marked "federal funds rate". It has four administered rates that fence the market in, and 3.88% is where overnight lending settled inside that fence.
The Fed Sets Five Interest Rates, Not One
Each of the four administered rates reaches a different set of counterparties, and that is the design. A floor that only banks can access leaks; a floor that money market funds can also access does not.
| Rate | Level | Who can use it | What it does |
|---|---|---|---|
| IORB | 3.90% | Banks with Fed reserve accounts | The main floor. A bank will not lend overnight below what the Fed pays it. |
| ON RRP | 3.75% | Money funds, GSEs, non-bank dealers | A second floor for lenders who cannot earn IORB. |
| Discount window | 4.00% | Banks borrowing against collateral | A soft ceiling. No bank pays more in the market than the Fed charges. |
| Standing repo facility | 4.00% | Primary dealers, eligible banks | A hard ceiling against repo spikes, added after September 2019. |
The four administered rates and their counterparties, from the September 16, 2026 implementation note. IORB at 3.90% sits 15 basis points below the top of the range and 15 above the bottom.
IORB is the lever that matters. The Fed pays 3.90% on reserves a bank leaves overnight, risk-free, with no balance-sheet cost worth mentioning. No rational bank lends those same reserves to another bank at 3.80%, so 3.90% becomes a floor under the entire overnight market without the Fed trading a single dollar.
ON RRP exists because that floor has a hole in it. Money market funds hold trillions and cannot earn IORB, so left alone they would lend below it and drag the market rate down. At 3.75% the Fed plugs that leak.
The two ceilings almost never bind. The discount window carries a stigma most banks will pay to avoid, and the standing repo facility is there for the kind of morning repo had in September 2019. Both sat unused through this cycle's turn, which is what you want from a backstop.
How a Target Range Becomes an Actual Market Rate
The Fed publishes three overnight benchmarks every morning for the previous session, and together they tell you whether the corridor is doing its job. All three currently sit within a basis point of each other, which is about as boring as money markets get.
| Benchmark | Rate | Volume | 1st pctile | 99th pctile |
|---|---|---|---|---|
| EFFR (unsecured, banks) | 3.88% | $118bn | 3.85% | 3.89% |
| OBFR (unsecured, broader) | 3.88% | $232bn | 3.80% | 3.94% |
| SOFR (secured, Treasury repo) | 3.89% | $3,025bn | 3.85% | 3.97% |
New York Fed reference rates for October 15, 2026. EFFR is a volume-weighted median of transactions reported on form FR 2420, published around 9:00am ET for the prior day. Not an average.
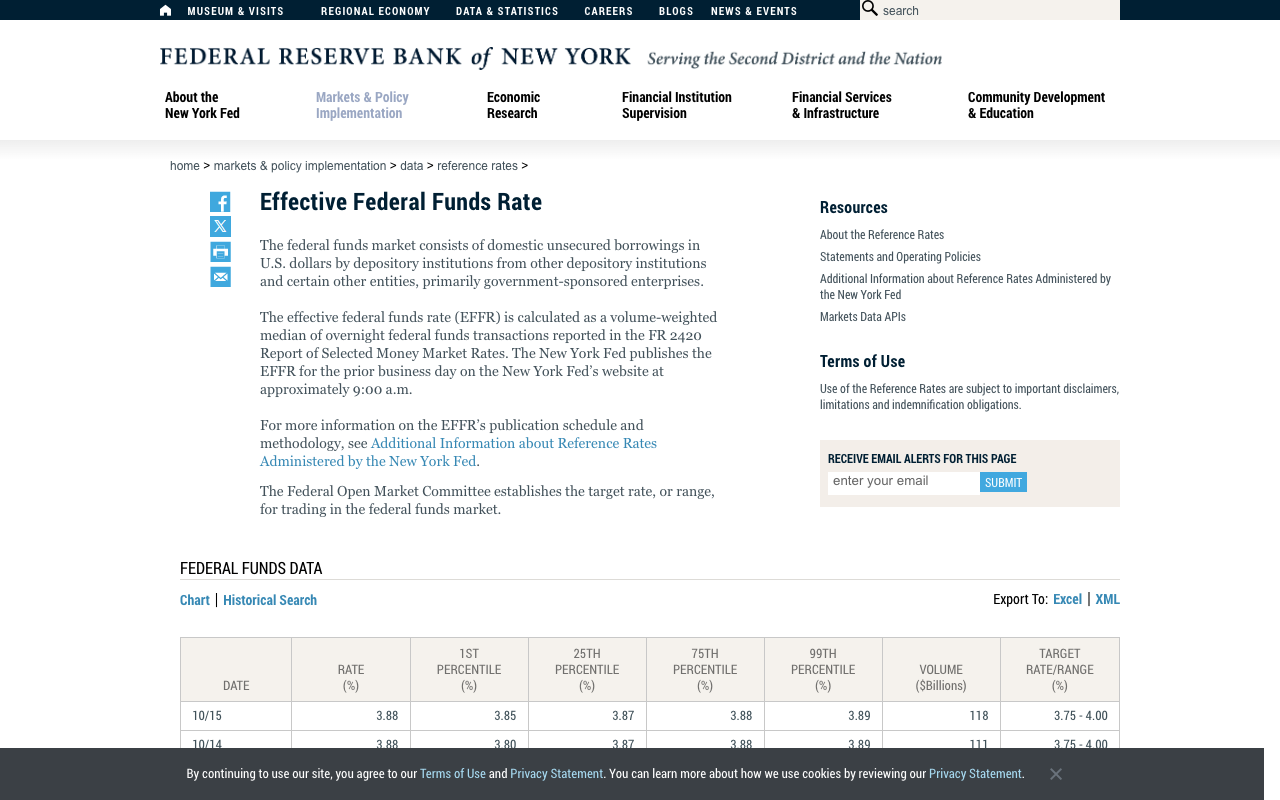
Two details in that table are worth more than the headline rate. First, EFFR's 1st-to-99th percentile spread is four basis points, from 3.85% to 3.89%. When funding gets tight that tail blows out well before the median moves, so a narrow distribution on $118 billion is a clean bill of health.
Second, SOFR clears $3.0 trillion a night against EFFR's $118 billion. SOFR prices floating-rate loans and swaps; EFFR is what the Fed targets and what prediction markets resolve against. They are 1 basis point apart today, and when they are not, something is wrong in repo rather than at the Fed.
How the Fed Got to 3.75-4.00% in 2026
This range is not new. The Fed was here twelve months ago on the way down, cut straight through it, then came back up to it. That round trip is the context every stale page on this subject is missing.
| Meeting | Decision | Resulting range | SEP |
|---|---|---|---|
| Sept 2025 | Cut 25bp | 4.00% - 4.25% | Yes |
| Oct 2025 | Cut 25bp | 3.75% - 4.00% | No |
| Dec 2025 | Cut 25bp | 3.50% - 3.75% | Yes |
| Jan 27-28, 2026 | Hold | 3.50% - 3.75% | No |
| Mar 17-18, 2026 | Hold | 3.50% - 3.75% | Yes |
| Apr 28-29, 2026 | Hold | 3.50% - 3.75% | No |
| Jun 16-17, 2026 | Hold | 3.50% - 3.75% | Yes |
| Jul 28-29, 2026 | Hold | 3.50% - 3.75% | No |
| Sept 15-16, 2026 | Hike 25bp | 3.75% - 4.00% | Yes |
| Oct 27-28, 2026 | Pending | - | No |
| Dec 8-9, 2026 | Pending | - | Yes |
Federal Reserve open market operations history and the FOMC calendar. SEP marks the meetings that publish a Summary of Economic Projections, the dot plot included. Dates shown are meeting dates; rate changes take effect the following day.
Five consecutive holds, then a hike. The September decision was unanimous at 12-0, which is unusual for a turn in direction and tells you the inflation data had stopped being arguable by the time the committee sat down.
The September projections moved with the vote. The median dot for end-2026 went from 3.8% in June to 4.1% in September, a 30 basis point revision in three months, with the committee's central tendency at 4.1-4.4%. The same round raised the 2026 core PCE median to 3.4% and cut the unemployment median from 4.3% to 4.1%. Our dot plot breakdown walks through the distribution behind those medians.
What Markets Say the Fed Does on October 28
This is the part the explainers leave out. You do not have to guess what the Federal Reserve does about interest rates at its next meeting, because two exchanges run order books on exactly that question and both are liquid.
| Outcome | Polymarket | Kalshi | Kalshi open interest |
|---|---|---|---|
| Cut 50bp or more | 0.15% | 0.5% | 223,425 |
| Cut 25bp | 0.35% | 0.5% | 1,255,002 |
| No change | 86.5% | 87.5% | 1,738,495 |
| Hike 25bp | 12.5% | 11.5% | 1,397,201 |
| Hike 50bp or more | 0.35% | 0.5% | 903,330 |
| Implied change | +3.14bp | +2.75bp | - |
Polymarket event 606422 ($44.3m volume, $4.2m liquidity) and Kalshi series KXFEDDECISION-26OCT, both read October 16, 2026. Kalshi figures are bid-ask midpoints. Implied change is each outcome multiplied by the basis points it delivers.
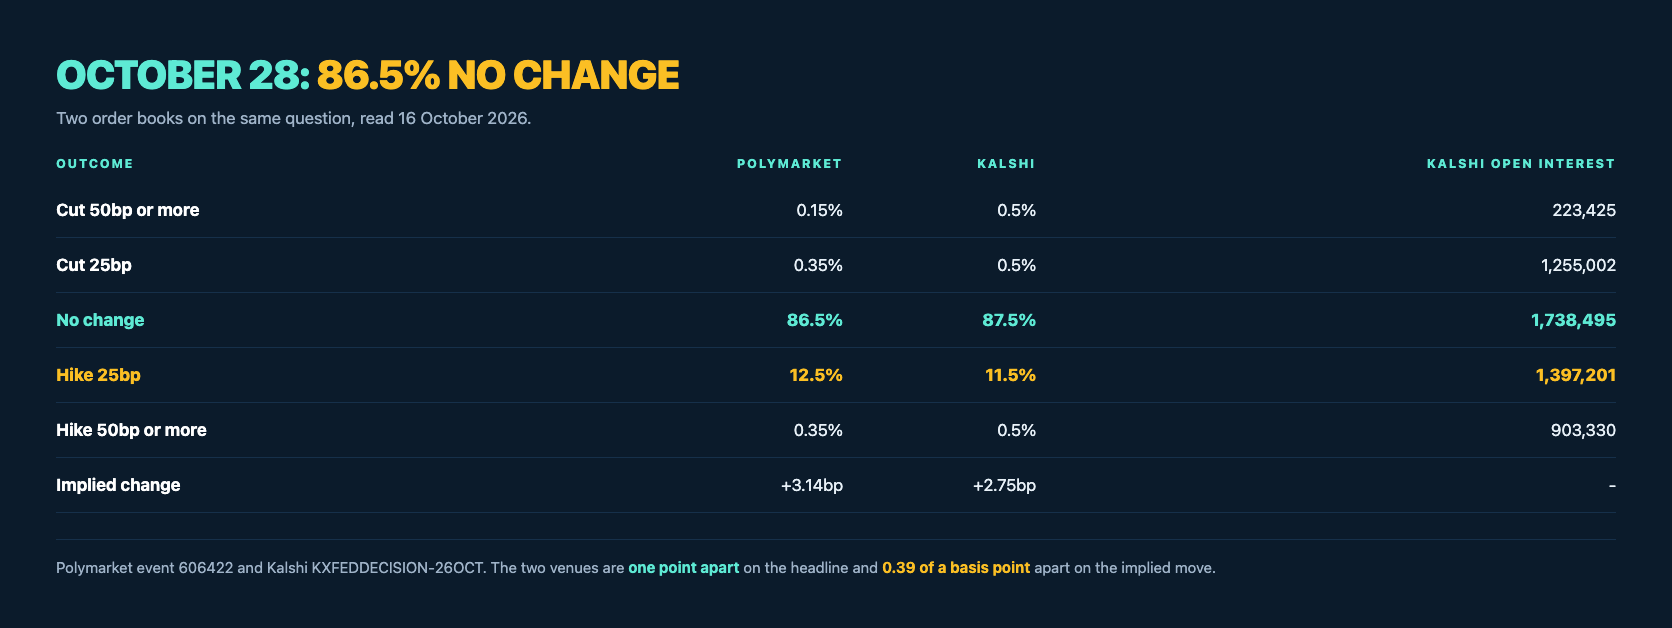
The two venues are one point apart on the headline and 39 hundredths of a basis point apart on the implied move. They do not share a matching engine, a user base or a settlement currency, so that is two independent crowds reaching the same answer rather than one price echoing.
Read the tails sceptically. Kalshi's cut and large-hike legs all show 0.5% because they are quoted 0 bid at 1 cent offered, and a midpoint on a one-cent-wide market at the bottom of a ladder is an artefact of the tick size, not a forecast. The honest reading is that Kalshi prices all three at a cent or less. Polymarket's ladder, quoted in tenths, sums to 99.85%, a rare underround.
There is a separate market on how divided the committee will be, and it is more interesting than the rate itself: no dissents is priced at just 17%, against September's actual 12-0. One dissent 21.5%, two 29.5%, three 18.5%, four or more 6.05%. Those sum to 92.6% on only $24,000 of volume, so treat the shape rather than the levels: after a unanimous hike, traders expect the October room to split.
December 8-9 Is Where the Hike Is Priced
Nothing about an 86.5% hold in October means the Fed is done. The next hike has simply been moved to the December meeting, and the December book is far more decisive than October's.
| Outcome | Polymarket | Kalshi |
|---|---|---|
| Cut 50bp or more | 0.45% | 0.5% |
| Cut 25bp | 0.65% | 1.5% |
| No change | 18.5% | 19.0% |
| Hike 25bp | 77.5% | 76.5% |
| Hike 50bp or more | 2.95% | 5.5% |
| Implied change | +20.46bp | +21.25bp |
Polymarket event 770450 ($3.6m volume) and Kalshi KXFEDDECISION-26DEC, read October 16, 2026. Kalshi quotes are bid-ask midpoints; its ladder sums to 103%, a 3-point overround, so its levels run slightly rich across the board.
A 77.5% chance of a quarter-point hike in December against 12.5% in October is a sharp statement about timing rather than direction. Both books agree the range is going to 4.00-4.25%; they disagree only about which of the two remaining meetings does it, and they are not really disagreeing much.
Two structural reasons sit behind that split. December publishes a Summary of Economic Projections and October does not, so a committee that wants to justify a second hike has the better venue in December. And the data calendar is lopsided: the committee gets another CPI print and another jobs report before December, while November CPI does not land until the day after the December vote.
Election timing is the other factor traders mention: October 27-28 falls six days before Election Day, and the Fed has historically preferred not to move at the meeting immediately before a federal election. That is a convention, not a rule.
The Hot CPI Print That Moved the Path by One Basis Point
On October 14 the Bureau of Labor Statistics reported September consumer prices up 0.6% on the month and 3.7% over the year, from 3.4% in August and above the 3.6% consensus. Core CPI rose 0.3% on the month and 2.6% annually, beating all but 11 of the 73 forecasters in Bloomberg's survey. On any ordinary reading, a hawkish shock.
The October hike contract agreed, for about six hours. Then it changed its mind completely. This is the round trip, from Polymarket's own price history in six-hour buckets.
| Time (UTC) | October hike 25bp | December hike 25bp | Note |
|---|---|---|---|
| Oct 11, 06:00 | 15.5% | - | Baseline, three days out |
| Oct 14, 12:00 | 18.5% | 75.5% | Half an hour before the CPI release |
| Oct 14, 18:00 | 33.0% | 79.5% | First full bucket after the print |
| Oct 15, 00:00 | 28.5% | 78.5% | Fading overnight |
| Oct 15, 06:00 | 23.5% | 78.5% | Still fading |
| Oct 16, 00:00 | 27.5% | 78.5% | Brief recovery |
| Oct 16, 06:00 | 14.5% | 78.5% | The whole move gone |
| Oct 16, 16:18 | 12.5% | 77.5% | Six points below the pre-CPI level |
Polymarket CLOB price history for the October and December 25bp hike contracts, one-month window at six-hour fidelity, read October 16, 2026. CPI was released at 12:30 UTC on October 14.
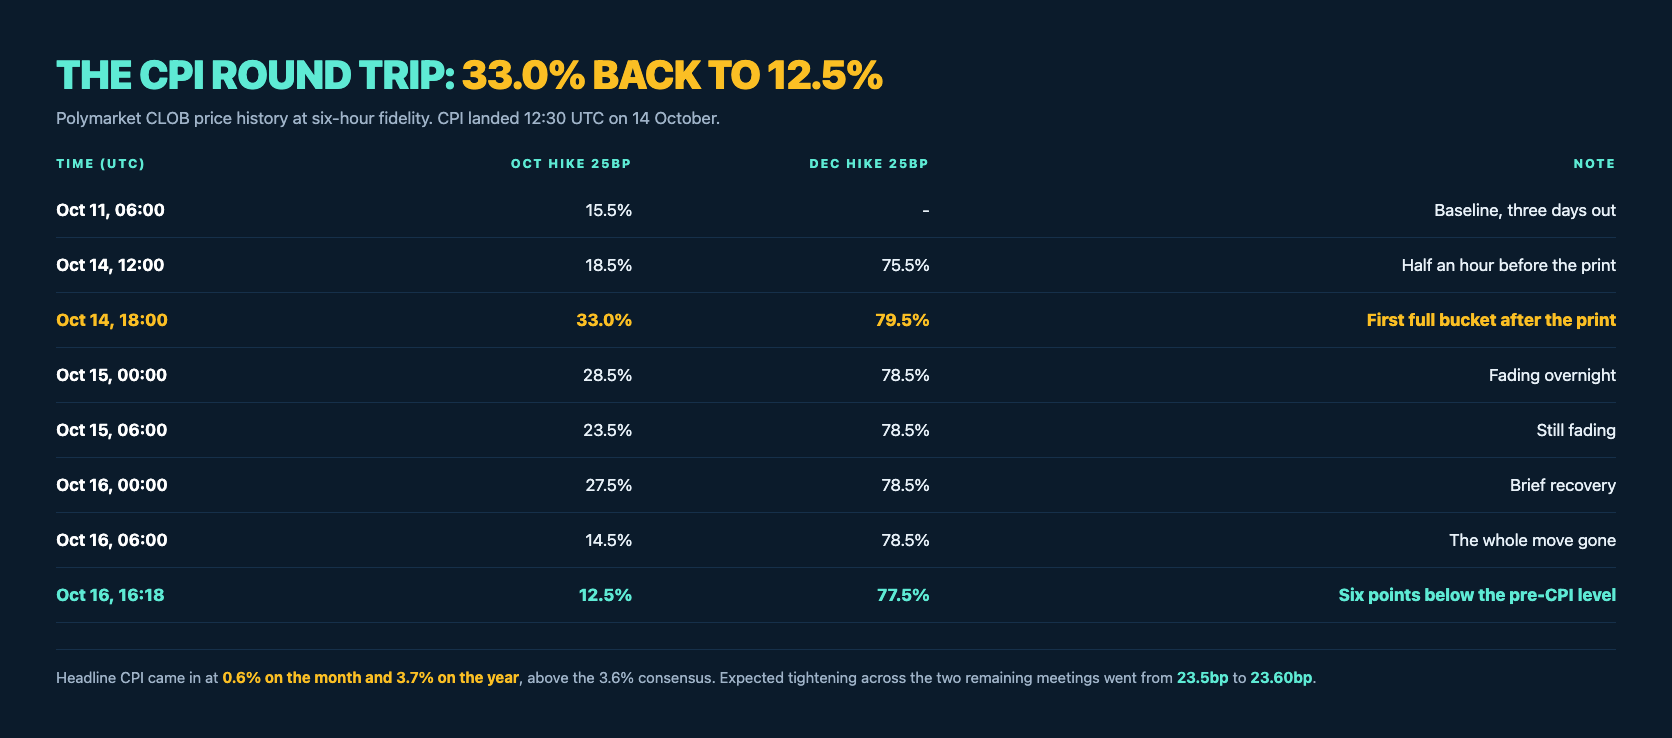
October's hike probability nearly doubled on the print, from 18.5% to 33.0%, and then over the following 48 hours gave back every point of it and six more. December's barely moved: 75.5% before, a 4-point pop, and 77.5% now.
Now do the arithmetic that matters. Before the CPI release the two 25bp legs implied about 23.5 basis points of tightening across the two remaining meetings. Today the full ladders imply 23.60 basis points. The hottest inflation print of 2026 moved the market's expected year-end federal funds rate by roughly one tenth of a basis point, while rotating six points of hike probability from October into December.
The bond market read it the same way. The 10-year closed at 5.21% on October 13, 5.19% on CPI day and 5.10% on October 15: a nine basis point rally in the two sessions after a hot print. Yields do not fall on hawkish news unless the market thinks the news is about growth, not policy.
Three Independent Estimates of the Year-End Rate
Here is the test I actually trust. Take each venue's October and December ladders, multiply every outcome by the basis points it delivers, sum them, and add the result to today's 3.875% midpoint. That gives a single market-implied year-end rate you can hold against the Fed's own published median.
| Source | October | December | Year-end midpoint |
|---|---|---|---|
| Polymarket | +3.14bp | +20.46bp | 4.11% |
| Kalshi | +2.75bp | +21.25bp | 4.12% |
| Fed September SEP median | - | - | 4.1% |
| Fed June SEP median | - | - | 3.8% |
Author's calculation from the ladders above, added to the 3.875% midpoint of the current target range, against Table 1 of the Federal Reserve's Summary of Economic Projections for September 16, 2026.
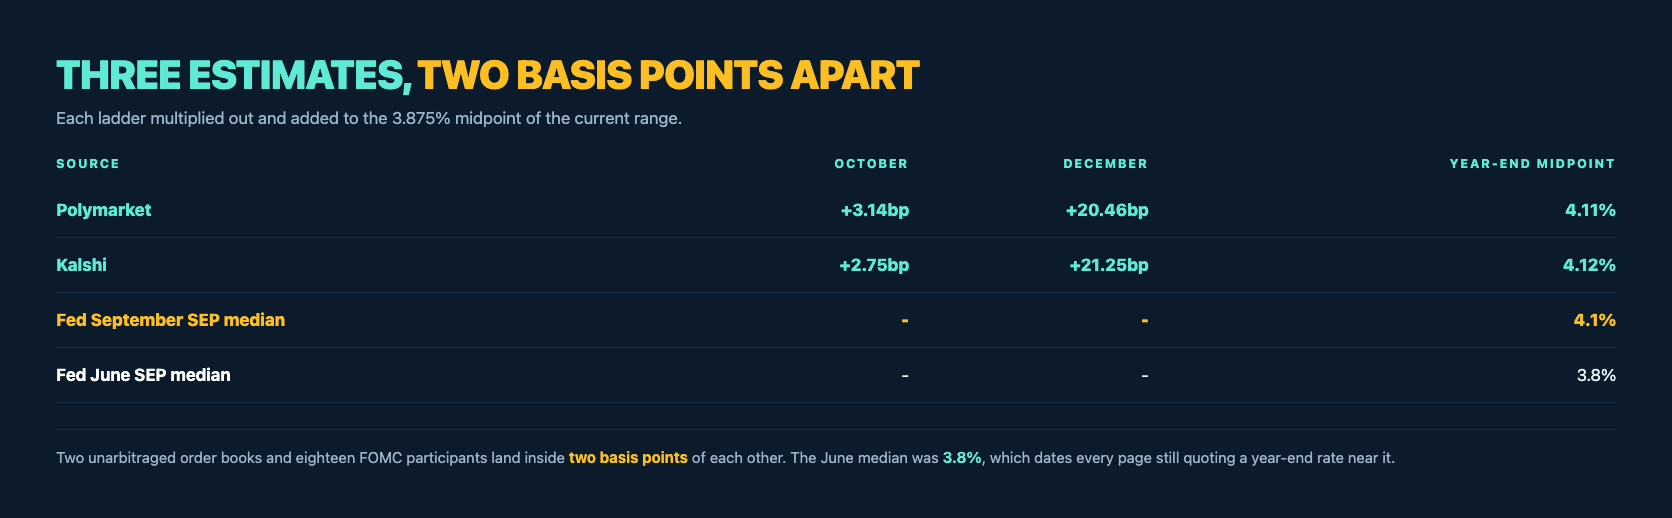
Two unarbitraged order books and eighteen FOMC participants land inside two basis points of each other. That is a stronger result than any one of the three on its own, and it is the single most useful fact on this page: there is currently no disagreement worth trading between what the Fed says it will do and what the market will pay for.
It also dates every stale page on this subject. The June median was 3.8%, so anything quoting a 2026 year-end rate near 3.8%, or a range of 3.50-3.75%, predates September 16 and has not been touched since.
One caveat on the method. Multiplying a ladder out this way assumes the outcomes are exhaustive and the quotes are tradeable, which is why the underround on Polymarket's October book and the 3-point overround on Kalshi's December book are both worth stating. Normalising each ladder to 100% moves the year-end numbers by less than a basis point, so the convergence survives the adjustment.
How the Fed's Rates Reach Your Mortgage, Savings and Card
The transmission from a 3.75-4.00% target range to the rate you are actually quoted is uneven, and 2026 has been an unusually good year for watching it break down.
| Rate | Level | Date | Link to the Fed |
|---|---|---|---|
| Bank prime loan rate | 7.00% | Oct 13, 2026 | Hard: target upper bound plus 300bp, moves within a day |
| 3-month Treasury bill | 4.28% | Oct 15, 2026 | Tight: prices the expected path over three months |
| 2-year Treasury | 4.77% | Oct 15, 2026 | Tight: prices the whole expected path |
| 10-year Treasury | 5.10% | Oct 15, 2026 | Loose: term premium and growth dominate |
| 30-year fixed mortgage | 7.40% | Oct 15, 2026 | Indirect: tracks the 10-year plus a spread |
| 15-year fixed mortgage | 6.71% | Oct 15, 2026 | Indirect: same mechanism, shorter duration |
Federal Reserve H.15 for the prime rate, Treasury daily par yield curve, and the Freddie Mac Primary Mortgage Market Survey for October 15, 2026.
Prime is the clean case: set by convention at the range's upper bound plus 300 basis points, so 4.00% plus 300 gives exactly the 7.00% published. Credit cards, home equity lines and most small-business borrowing are quoted as prime plus a margin, which is why they repriced within days of September 17.
The short end is nearly as tight, and it quietly corroborates the December hike. The 3-month bill yields 4.28%, 28 basis points above the top of the target range and 40 above the effective funds rate. A bill maturing in mid-January does not out-yield the overnight rate unless the market expects that rate to rise first.
The long end is where the link breaks. The 10-year opened 2026 at 4.19%, peaked at 5.31% on October 5 and sits at 5.10%, more than a point of range in a year when the Fed moved once. The 30-year mortgage followed the 10-year, not the Fed: 7.40% on October 15, up from 7.03% in late September. Our mortgage rate prediction piece covers why that spread stopped compressing.
So the honest answer depends on which of your rates you mean. A credit card tracks the Fed almost perfectly. A mortgage tracks a 10-year yield that has spent 2026 ignoring it.
How to Read the Next Decision Yourself
Everything on this page came from five free sources and about twenty minutes. The method, in order:
- Read the implementation note, not the statement. The statement gives you the target range. The note gives you IORB, ON RRP, the discount rate and the effective dates, which is where the mechanism lives.
- Check EFFR against the range. The New York Fed publishes it daily with the full percentile distribution and volume. A widening 1st-to-99th spread is a funding problem showing up before anything else does.
- Multiply the ladder, do not quote one leg. A single "86.5% hold" is less informative than the implied basis-point move across the whole ladder, and it is the only form you can compare against a dot plot.
- Check the two venues against each other. Polymarket and Kalshi agreeing to a point is a signal. A wide gap is usually an overround or a thin book, not an arbitrage.
- Mind the announcement-versus-effective date. The Fed's own history table uses the effective date. Markets resolve on the announcement.
The lesson of this particular fortnight is how little a shocking data point moved the destination. The path rotated between two meetings; the year-end number did not budge. Take the arithmetic in the year-end table if you take one habit from this page: it is the only form of the question that the market and the committee answer in the same units.
Frequently asked questions
What are the Federal Reserve's interest rates right now?
The federal funds target range is 3.75% to 4.00%, effective September 17, 2026. Alongside it the Fed sets interest on reserve balances at 3.90%, the overnight reverse repo rate at 3.75%, and both the discount window and standing repo facility at 4.00%. The effective federal funds rate, which is the market outcome rather than an administered rate, printed 3.88% on October 15, 2026.
Will the Federal Reserve raise interest rates in October 2026?
Probably not. Polymarket prices an 86.5% chance of no change at the October 27-28 meeting against 12.5% for a quarter-point hike, and Kalshi prices 87.5% against 11.5% with 1.74 million contracts of open interest on the hold. Both books put the next hike in December instead, at 77.5% and 76.5% respectively.
Why does the Fed set a range instead of a single interest rate?
Because since 2008 it steers overnight rates with administered rates rather than by trading securities each morning. With abundant bank reserves, open market operations no longer move the rate reliably, so the Fed sets a floor (interest on reserves, plus reverse repo for non-banks) and a ceiling (the discount window and standing repo facility) and lets the market clear between them. The effective rate of 3.88% is where it cleared.
What is the difference between IORB and the federal funds rate?
IORB is a price the Fed sets; the federal funds rate is a price the market produces. The Fed pays 3.90% on reserve balances held overnight, which makes banks unwilling to lend below that, and the effective federal funds rate is then the volume-weighted median of what banks actually charged each other. Today that is 3.88%, two basis points under IORB.
Did the hot September CPI report change the Fed's expected path?
Barely. The October 14 release showed headline CPI at 3.7% year over year and core at 2.6%, both above consensus, and October hike odds jumped from 18.5% to 33.0% within hours. Within 48 hours the market had given all of it back, closing at 12.5%. The implied year-end federal funds rate went from about 23.5 basis points of tightening to 23.60, a change of roughly one tenth of a basis point.
What does the Fed's own dot plot say about the end of 2026?
The September 16, 2026 Summary of Economic Projections put the median federal funds rate at 4.1% for end-2026, up from 3.8% in June, with a central tendency of 4.1% to 4.4%. Polymarket's ladders imply 4.11% and Kalshi's imply 4.12%, so the market and the committee currently agree to within about two basis points.
When is the next Federal Reserve meeting?
October 27-28, 2026, with the decision announced at 2:00pm ET on the 28th and any rate change effective the following day. The final 2026 meeting is December 8-9. December publishes a Summary of Economic Projections and October does not, which is one reason the market has the hike priced into December.
How do Federal Reserve interest rates affect mortgage rates?
Indirectly and unreliably. The prime rate moves mechanically with the Fed, at the target upper bound plus 300 basis points, so it is 7.00% today. Mortgages instead track the 10-year Treasury plus a spread, and in 2026 the 10-year has moved from 4.19% to 5.10% while the Fed changed its target range once. The 30-year fixed was 7.40% on October 15, 2026.