Fed Funds Rate 2026: Target Range and Odds
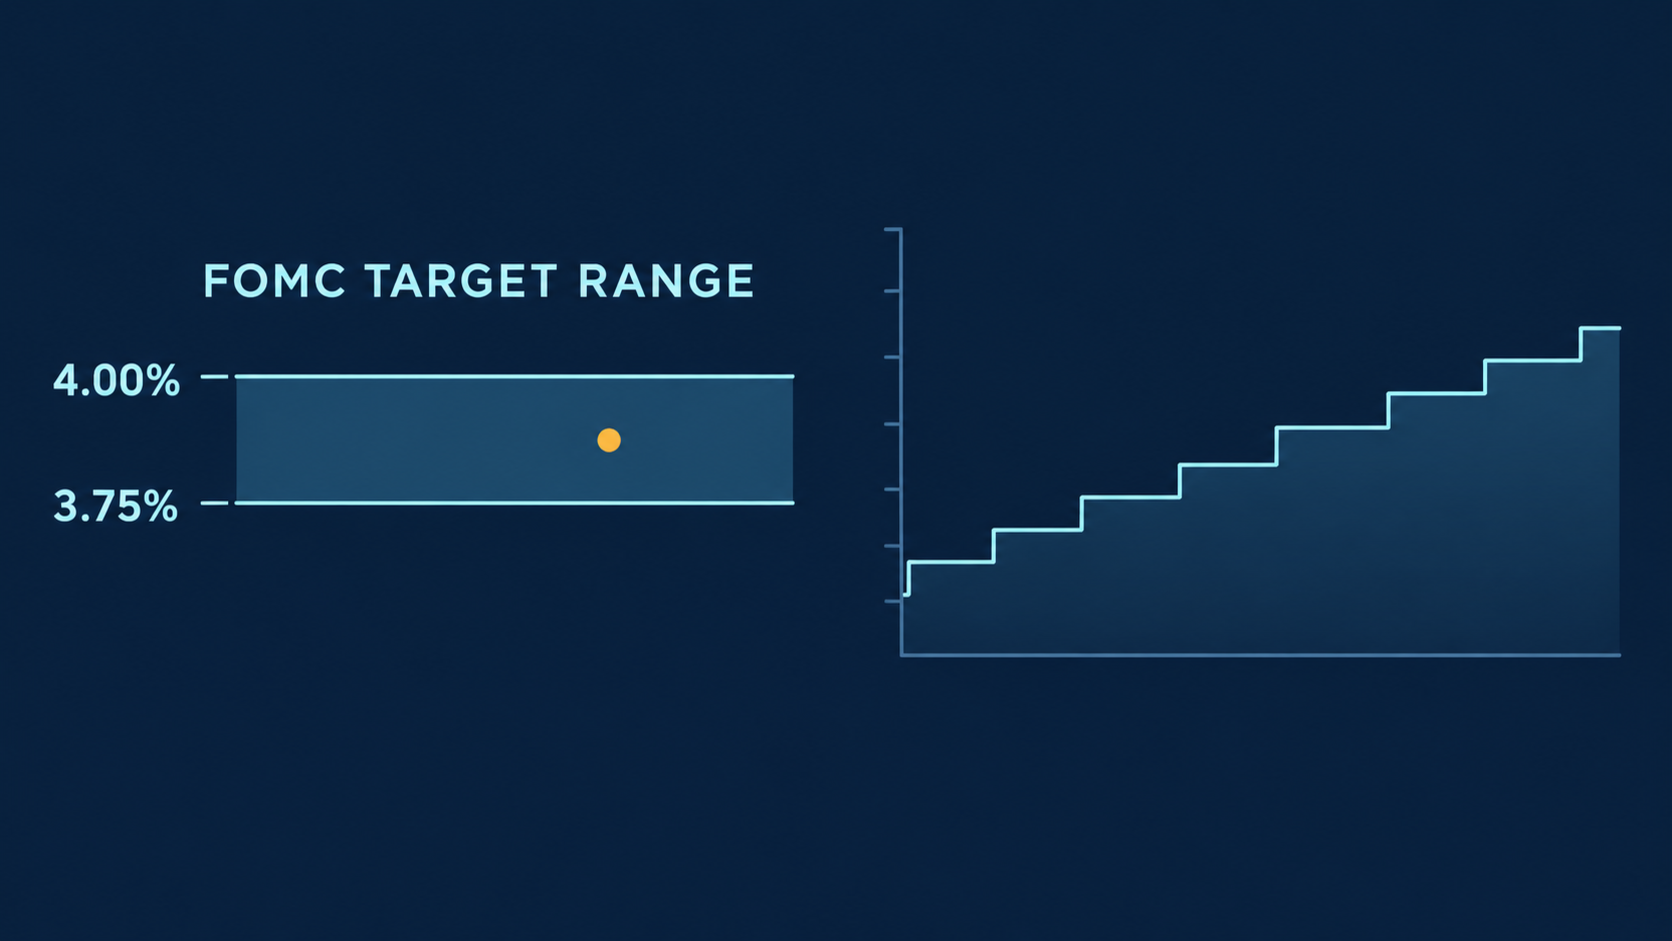
If you searched fed funds rate looking for the current number, it is 3.75% to 4.00%, and a lot of what ranks for that query is wrong. Pages still high in the results print 3.50% to 3.75%, which was correct until September 17, and at least one quotes a Fed median of 3.4% for the end of 2026, which is a figure from the 2025 dot plot and roughly 70 basis points stale.
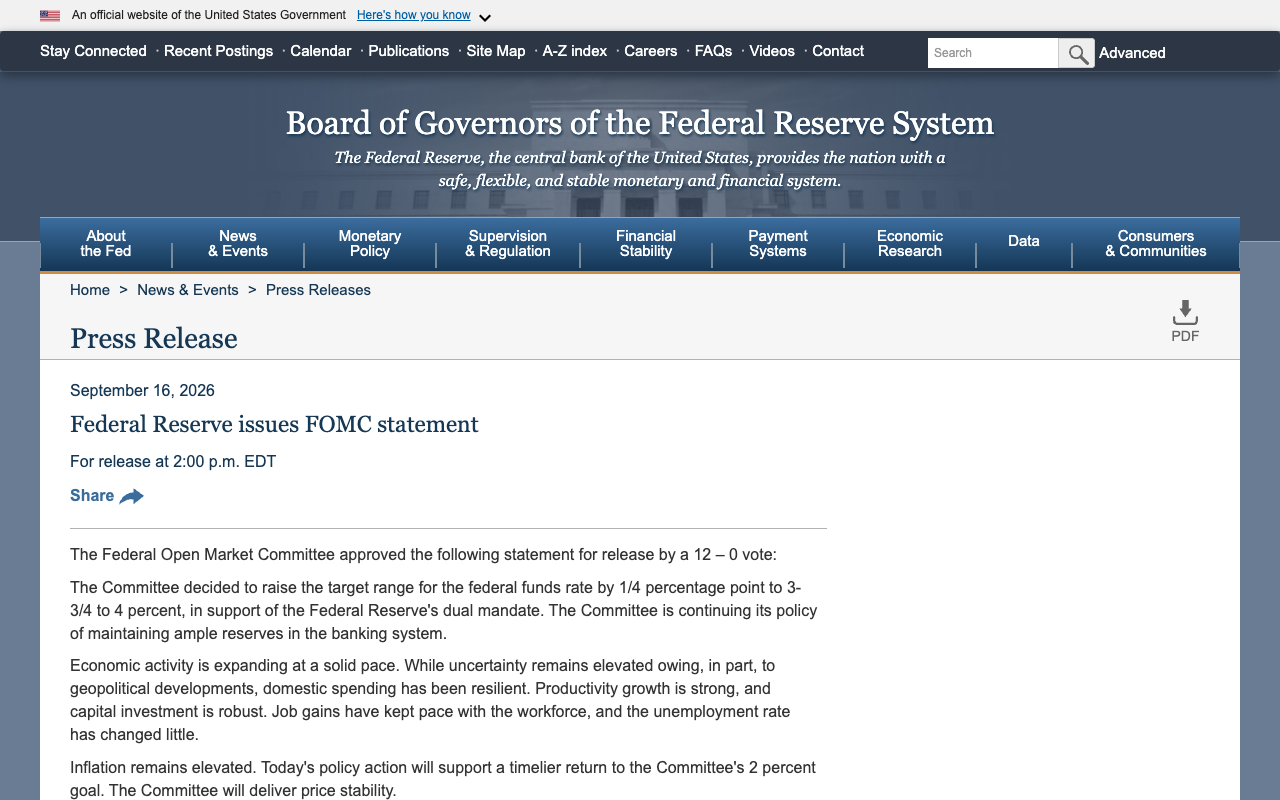
That matters more than a typo normally would, because the direction of the cycle changed. The Fed cut six times between September 2024 and December 2025, sat still for nine months, and then raised the target range on September 16, 2026. Anyone working off a page written before that date thinks the Fed is easing. It is not.
So this page does two things nothing else in those results does. It gives you the target range next to the four overnight rates that actually trade inside it, and it gives you what the prediction markets are charging for the next three meetings, because the number people usually want is not today's rate but the one they will be borrowing at. I pulled every figure below from primary sources this evening and I have dated each one.
Sources are the Federal Reserve statement and projections, the New York Fed reference rates, the FRED target-range series and the full Polymarket and Kalshi ladders. Everything was captured on October 6, 2026 between 21:10 and 21:40 UTC unless dated otherwise.
The Fed Funds Rate Today: 3.75% to 4.00%
The Federal Open Market Committee does not set one rate. It sets a 25 basis point target range, and then a cluster of real overnight rates trades inside it. Confusing the two is the single most common mistake in writing about this, so here is the whole cluster side by side.
| Rate | Latest | As of | What it is |
|---|---|---|---|
| FOMC target range | 3.75% to 4.00% | Sep 17, 2026 | The policy decision. A range, not a point. |
| Effective federal funds rate (EFFR) | 3.88% | Oct 5, 2026 | Volume-weighted median of actual overnight fed funds trades. $121bn of volume. |
| Interest on reserve balances (IORB) | 3.90% | Oct 6, 2026 | What the Fed pays banks on reserves. The administered rate that anchors the others. |
| Secured overnight financing rate (SOFR) | 3.89% | Oct 5, 2026 | Overnight Treasury repo. $3,007bn of volume, the deepest of the four. |
| Overnight bank funding rate (OBFR) | 3.88% | Oct 5, 2026 | EFFR plus Eurodollar and selected deposit activity. |
| Range midpoint | 3.875% | Oct 6, 2026 | The convention the Fed's own dot plot uses. |
Target range via FRED series DFEDTARU and DFEDTARL; EFFR, SOFR and OBFR from the New York Fed reference rates API; IORB via FRED. October 6, 2026.
Two things worth noticing. EFFR sits at 3.88%, thirteen basis points above the bottom of the range and twelve below the top, which is exactly where a well-behaved floor system puts it. And IORB at 3.90% is above every market rate in the table, which is the mechanism: banks will not lend below what the Fed pays them, so the administered rate does the work and the range is a ceiling and floor rather than a target the desk has to hit.
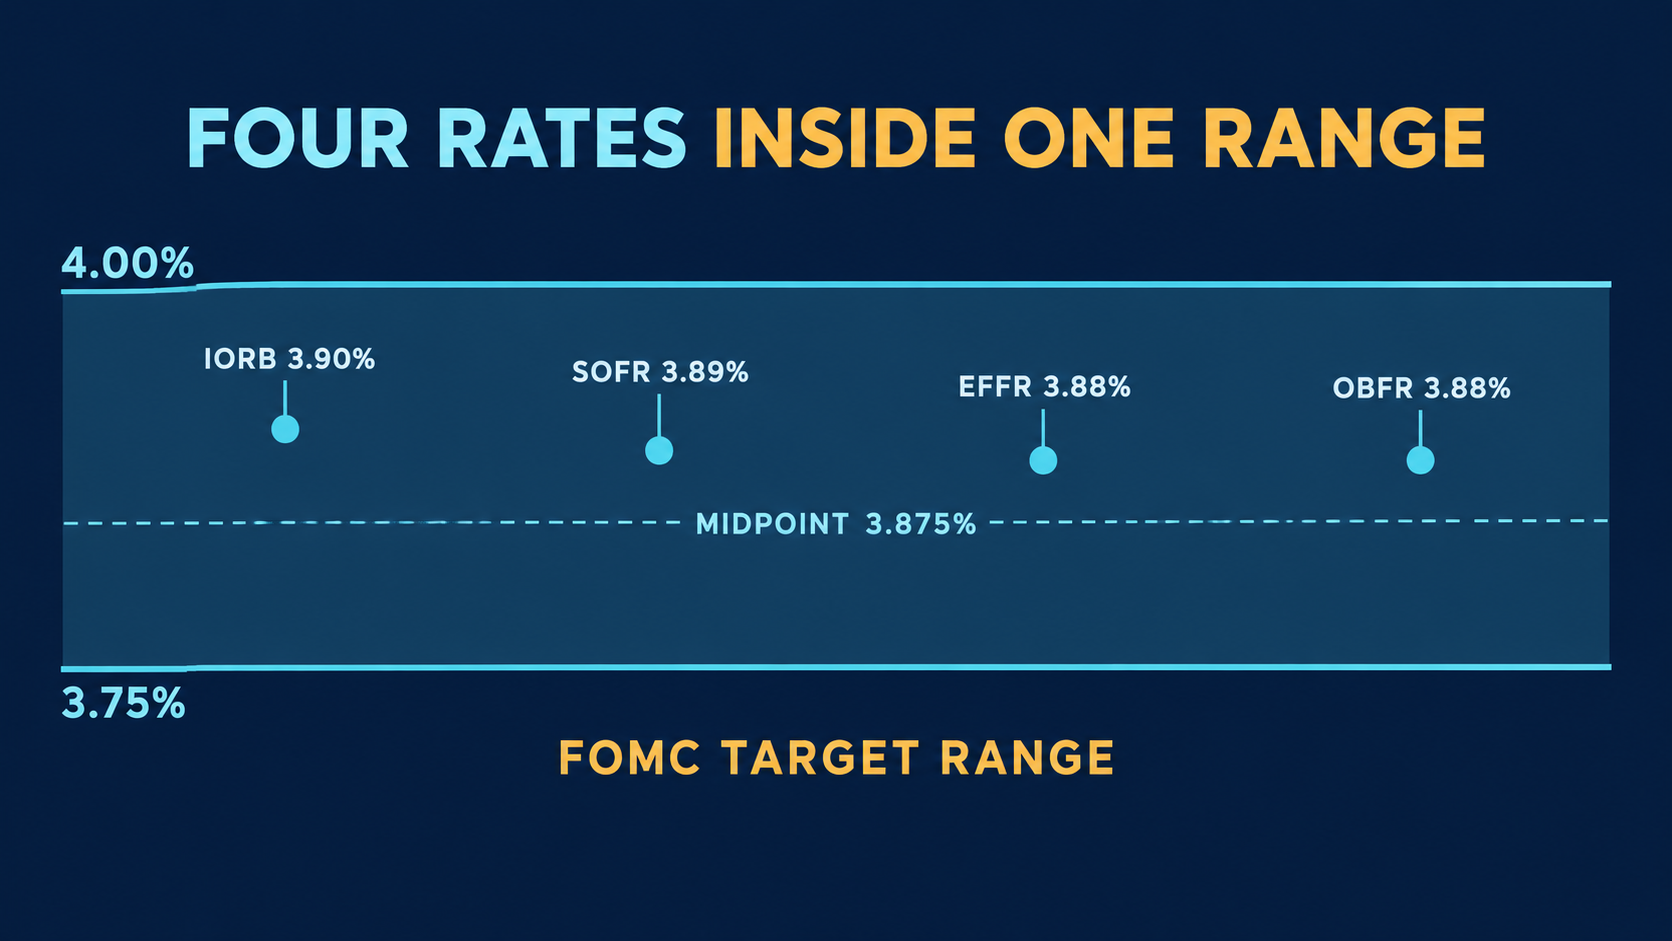
If you need one number, use the midpoint of 3.875%. That is the convention the Fed's own projections use, and the only way to compare the policy rate against the dot plot without being an eighth of a point out.
Why the Fed Funds Rate Is a Range, Not a Number
Before 2008 the Fed targeted a single rate and the New York desk bought and sold securities every morning to keep the market there. After the crisis the system had far more reserves than that approach can handle, so the Fed switched to a floor system: pay interest on reserves, set a range, and let the administered rate pull everything into it.
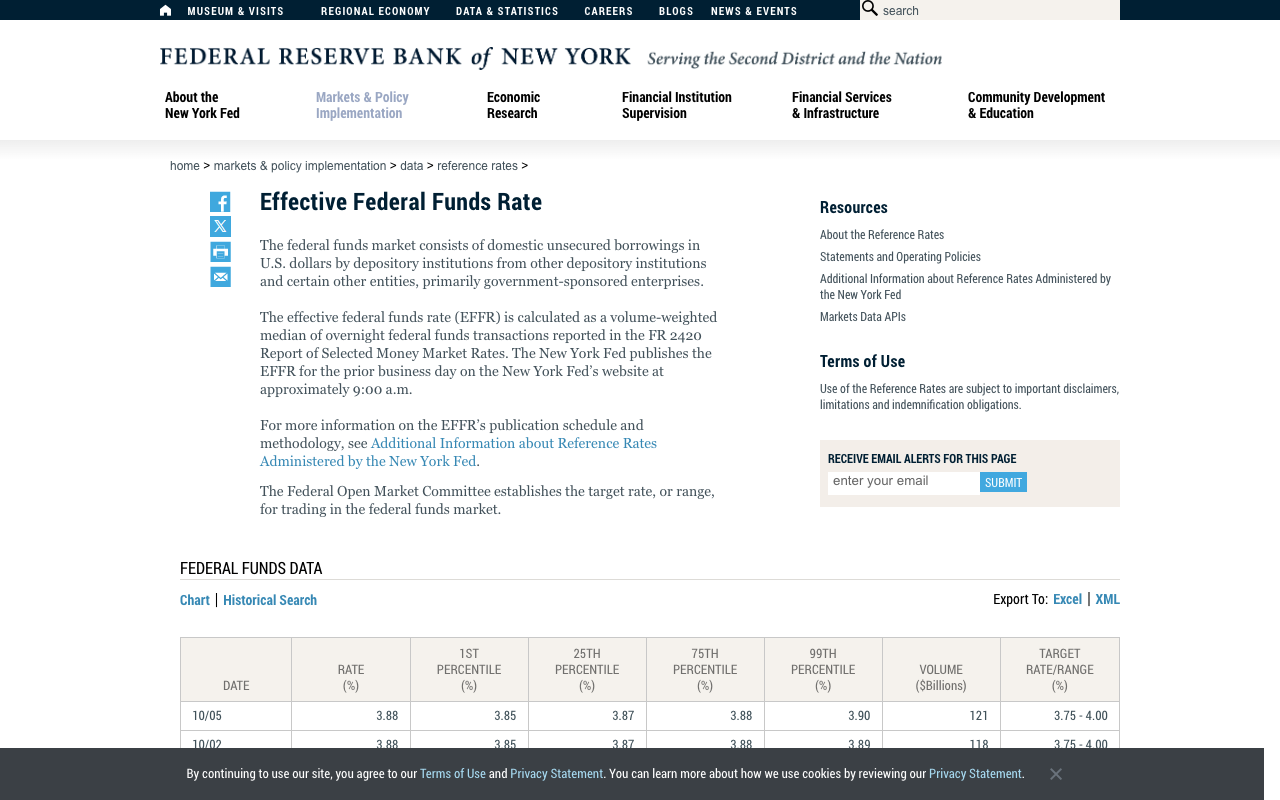
The consequence is that the fed funds rate you read about is a decision, and the fed funds rate that exists is a statistic. The New York Fed publishes EFFR each business day at about 9:00am Eastern for the previous day, calculated as the volume-weighted median of overnight unsecured borrowings reported on the FR 2420 Report of Selected Money Market Rates. A median, not an average, so a handful of odd trades cannot drag it.
On October 5 the distribution around that median was tight: the 1st percentile printed 3.85% and the 99th printed 3.90%. Five basis points of spread across $121bn says the plumbing is calm, worth checking whenever people start talking about funding stress.
How the Fed Funds Rate Got Here: Every Move Since 2022
Here is the complete path. This is every change to the target range since the zero floor, taken from the FRED upper and lower bound series rather than from anybody's summary, so the effective dates are the ones the Fed actually used.
| Effective | New target range | Move | Note |
|---|---|---|---|
| Mar 17, 2022 | 0.25% to 0.50% | +25 bps | Liftoff from the zero floor |
| May 5, 2022 | 0.75% to 1.00% | +50 bps | |
| Jun 16, 2022 | 1.50% to 1.75% | +75 bps | First of four consecutive 75s |
| Jul 28, 2022 | 2.25% to 2.50% | +75 bps | |
| Sep 22, 2022 | 3.00% to 3.25% | +75 bps | |
| Nov 3, 2022 | 3.75% to 4.00% | +75 bps | Same range we are in today |
| Dec 15, 2022 | 4.25% to 4.50% | +50 bps | |
| Feb 2, 2023 | 4.50% to 4.75% | +25 bps | |
| Mar 23, 2023 | 4.75% to 5.00% | +25 bps | |
| May 4, 2023 | 5.00% to 5.25% | +25 bps | |
| Jul 27, 2023 | 5.25% to 5.50% | +25 bps | Cycle peak, held 14 months |
| Sep 19, 2024 | 4.75% to 5.00% | -50 bps | First cut, a double |
| Nov 8, 2024 | 4.50% to 4.75% | -25 bps | |
| Dec 19, 2024 | 4.25% to 4.50% | -25 bps | Then a nine-month hold |
| Sep 18, 2025 | 4.00% to 4.25% | -25 bps | |
| Oct 30, 2025 | 3.75% to 4.00% | -25 bps | |
| Dec 11, 2025 | 3.50% to 3.75% | -25 bps | Easing cycle trough, held 9 months |
| Sep 17, 2026 | 3.75% to 4.00% | +25 bps | First hike since 2023, 12 to 0 vote |
FRED series DFEDTARU and DFEDTARL. 525 basis points of hikes across 11 moves, then 175 basis points of cuts across 6, then one hike back.
The shape is the story. The Fed gave back a third of its tightening and then stopped, sat at 3.50% to 3.75% for nine months, and turned round. We are now in the odd position of being at a range the Fed passed through on the way up in November 2022, and the committee's own projections say it is not finished.
The September statement put the vote at 12 to 0 and framed the move as support for the dual mandate with inflation above target. No dissent on a turn in direction is unusual, and it is part of why the market took the guidance at face value. I covered that setup in Fed rate hike odds for September 2026.
What the Market Prices for the Next Three Meetings
This is the part the pages ranking for this keyword leave out. Polymarket runs each outcome as a separate binary, so the raw columns do not sum to 100 and I have given the ladder totals. Kalshi quotes the same five outcomes as strikes under its KXFEDDECISION series, bid and ask in cents.
| Outcome | Oct 27-28 Poly | Oct 27-28 Kalshi | Dec 8-9 Poly | Dec 8-9 Kalshi | Jan 26-27 Poly |
|---|---|---|---|---|---|
| Cut 50 bps or more | 0.15% | no bid / 1c | 0.35% | no bid / 1c | 1.20% |
| Cut 25 bps | 0.45% | no bid / 1c | 1.05% | 1c / 3c | 2.15% |
| No change | 82.50% | 83c / 84c | 22.50% | 26c / 27c | 62.50% |
| Hike 25 bps | 16.50% | 17c / 18c | 74.50% | 71c / 72c | 33.50% |
| Hike 50 bps or more | 0.35% | no bid / 1c | 2.95% | 2c / 3c | 1.85% |
| Raw ladder total | 99.95% | 102.5% | 101.35% | 103.0% | 101.20% |
Polymarket events "Fed Decision in October?" ($27.3m), "in December?" ($2.7m) and "in January?" ($0.25m), last traded. Kalshi KXFEDDECISION-26OCT and -26DEC strikes, bid/ask. October 6, 2026, 21:25 UTC.
October is effectively decided and December is the live meeting. A hold on October 28 is 82.5% on Polymarket and a mid of 83.5c on Kalshi, which is about as close to agreement as two venues with completely different user bases get. The Kalshi October maintain strike carries 1,396,398 contracts of open interest, so that is not a thin quote.
December is where the disagreement lives, and it is small: Polymarket 74.5% on a quarter point against a Kalshi mid of 71.5%, a three point spread on a book with 117,995 contracts of open interest. January then prices a 33.5% chance of yet another hike, which is the market saying the Fed might not stop at one. You can watch all three ladders move on the live Fed decision odds page.
The Market Has Converged on the Fed's Own Dot
Here is the calculation worth doing, and I have not seen anyone else do it. Take each meeting ladder, multiply every outcome by the basis points it delivers, and add them. That gives you the market's expected change in the target range, and therefore the level it implies for the end of the year.
| Venue | Expected Oct move | Expected Dec move | Total | Implied year-end midpoint |
|---|---|---|---|---|
| Polymarket | +4.11 bps | +19.66 bps | +23.78 bps | 4.11% |
| Kalshi (bid/ask mids) | +4.25 bps | +18.38 bps | +22.63 bps | 4.10% |
| Fed, September 2026 SEP median | 4.1% | |||
| Polymarket, September 29 | +17.13 bps | +19.25 bps | +36.38 bps | 4.24% |
Probability-weighted expected change applied to the 3.875% midpoint. Fed median from the September 16, 2026 Summary of Economic Projections. The last row uses September 29 closes on the same two contracts.
Two venues, two different crowds, and both land within a basis point of the Fed's own median of 4.1%. That is a stronger result than it looks, because the two books are not arbitraged against each other in any practical way and they got to the same place from different prices.
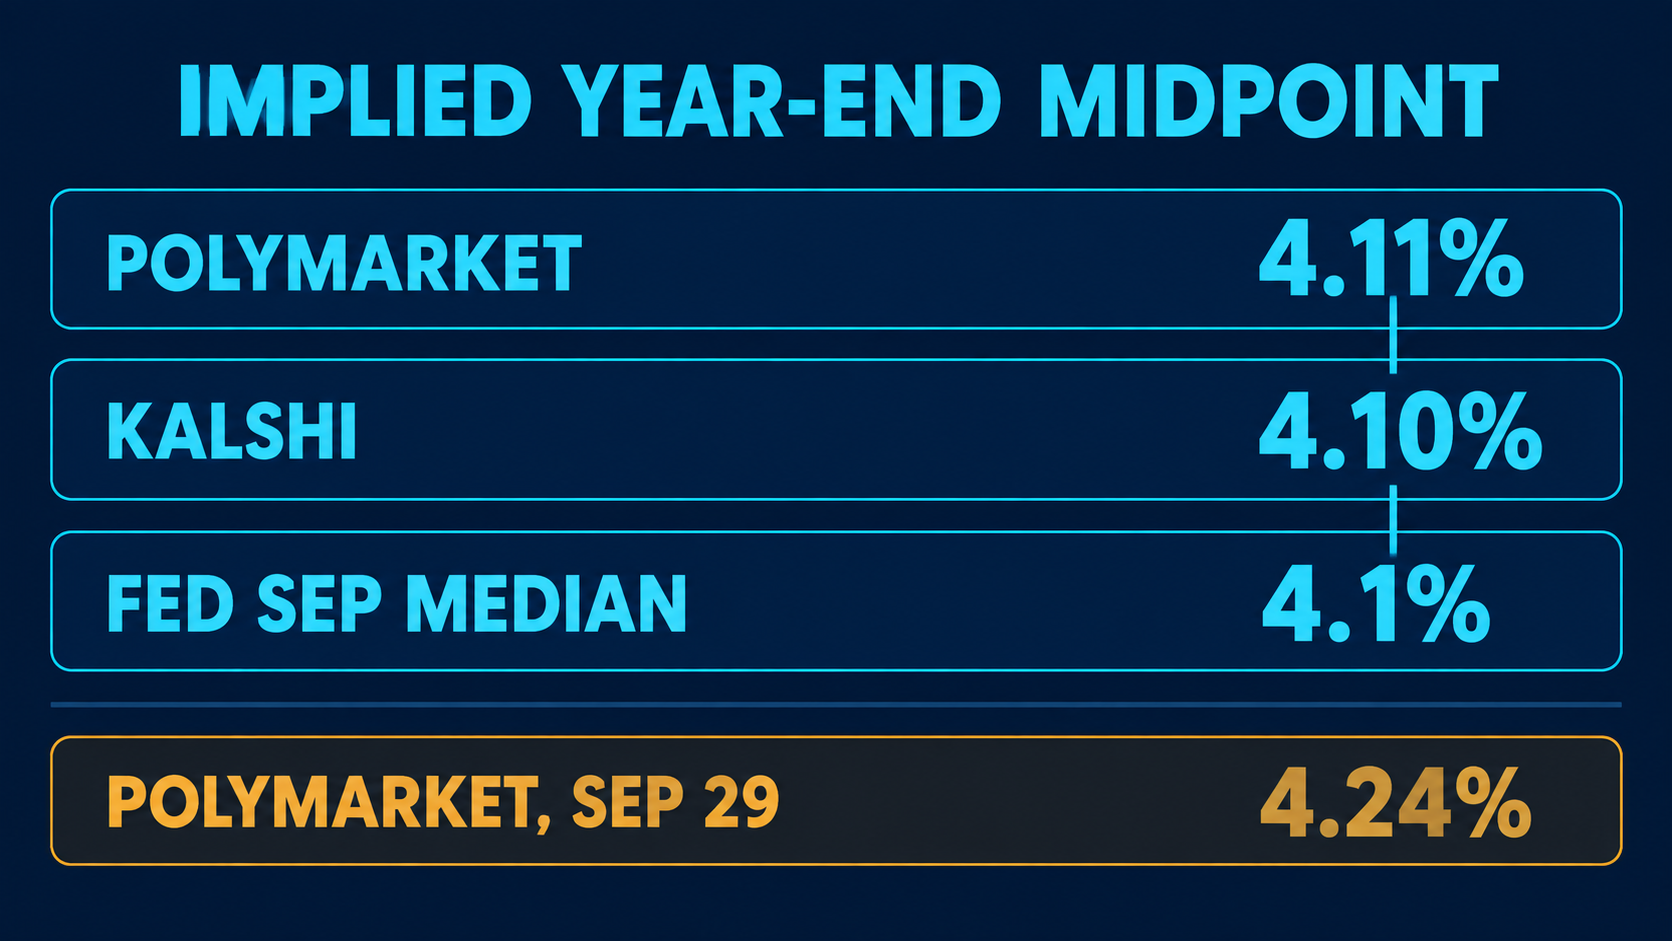
The bottom row is the interesting one. On September 29 the same arithmetic gave 4.24%, which means the market was pricing roughly 1.46 more hikes rather than one. After the September employment report landed on October 2 with payrolls up 29,000 and July revised into outright job losses, that collapsed to 0.95 hikes. The market did not stop believing in the hike. It stopped believing in the *second* one, which is exactly what closes the gap to a committee that projected one more.
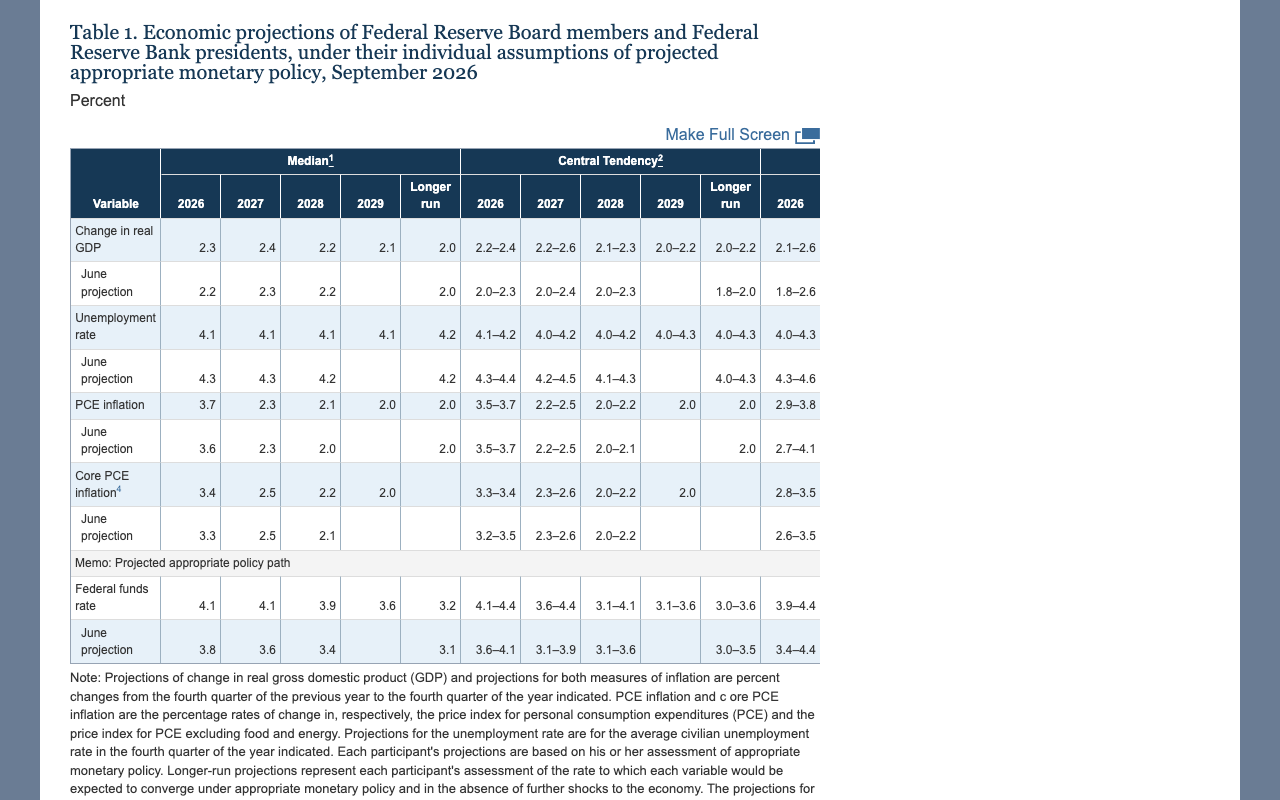
For context on the Fed's side of that, the September projections put PCE inflation at 3.7% and core PCE at 3.4% for 2026 on a fourth-quarter basis, unemployment at 4.1% and growth at 2.3%, with the funds rate median flat at 4.1% again through 2027 before easing to 3.9% in 2028 and 3.2% in the longer run. I went through the composition of those dots in the September dot plot breakdown.
The Hike Did Not Disappear, It Moved to December
Most of the coverage of the October 2 jobs report led on hike odds collapsing. That is true of one contract and false of the complex. Here are the two meeting ladders day by day over the last two weeks, from the Polymarket CLOB daily history.
| Date (00:00 UTC) | Oct hike 25 bps | Dec hike 25 bps | Oct-to-Dec spread |
|---|---|---|---|
| Sep 25 | 66.5% | 71.5% | 5 pts |
| Sep 28 | 64.5% | 67.5% | 3 pts |
| Sep 29 | 68.5% | 77.0% | 8.5 pts |
| Sep 30 | 43.5% | 75.5% | 32 pts |
| Oct 1 | 33.5% | 73.5% | 40 pts |
| Oct 2 | 25.5% | 67.5% | 42 pts |
| Oct 3 | 17.5% | 74.5% | 57 pts |
| Oct 5 | 16.5% | 71.5% | 55 pts |
| Oct 6 | 16.5% | 74.5% | 58 pts |
Polymarket prices-history, 1m interval at daily fidelity, 25 bps hike market on each event. October lost 52 points between September 29 and October 6; December gained 7.
The October contract shed 52 points and the December contract finished higher than it started. The spread between the two went from 8.5 points to 58 points in eight days. That is not a market abandoning a hike, it is a market moving one, and the distinction decides whether you think the next six weeks of data can still change the answer.
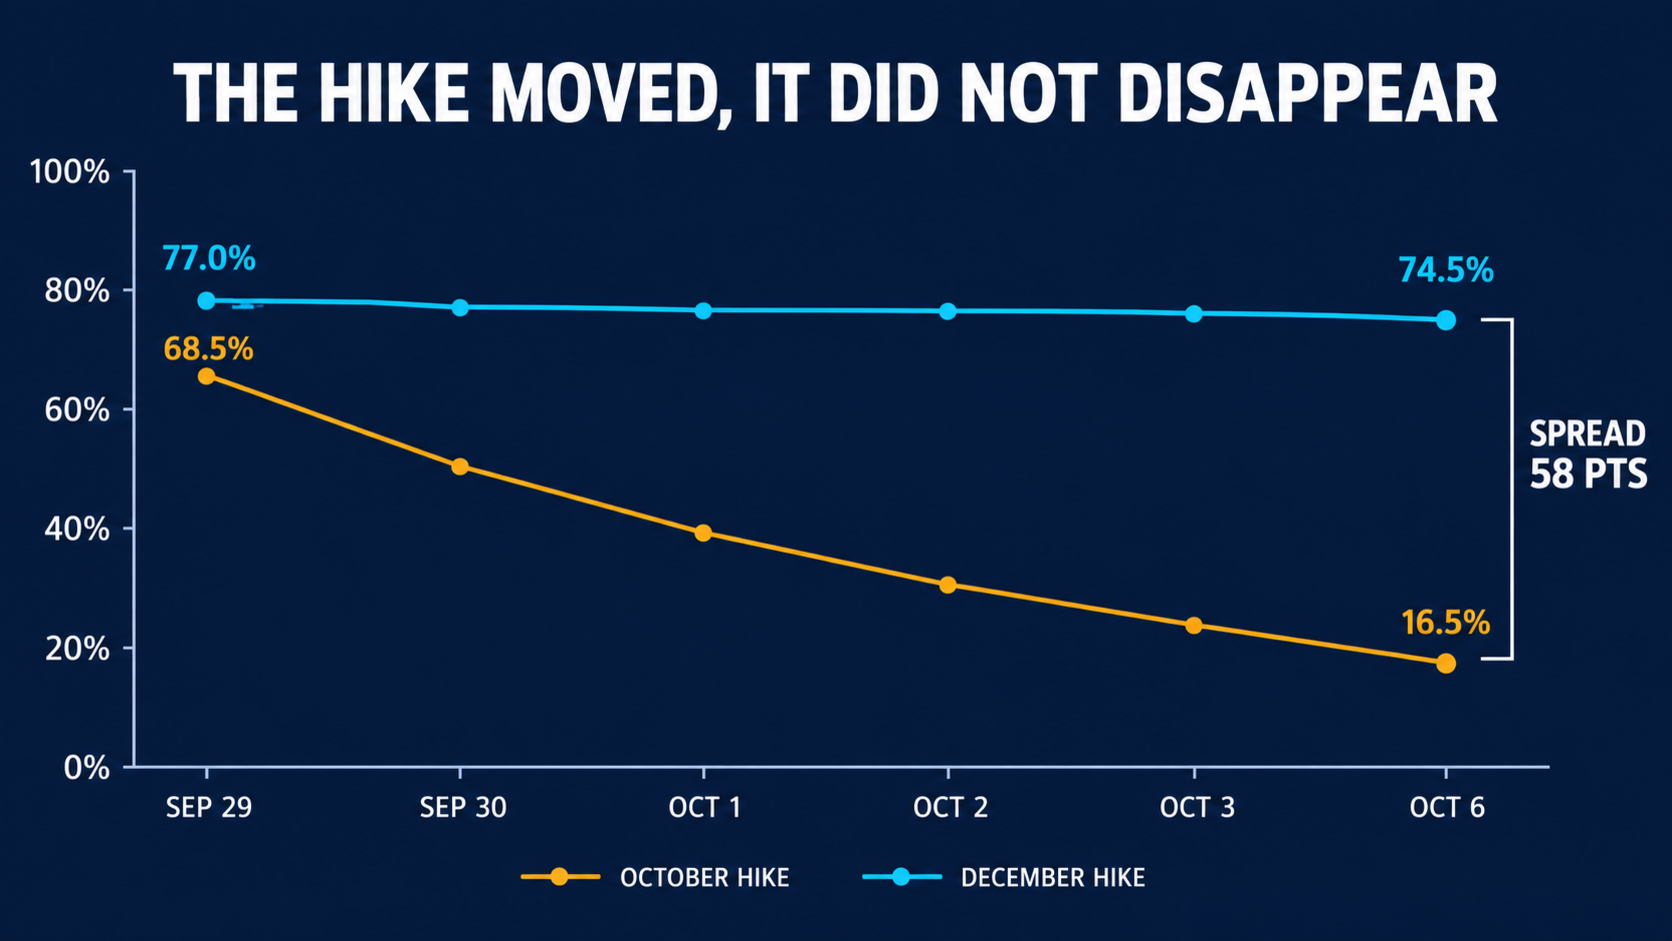
Note that the slide began on September 30, two days before the jobs report, when October fell 25 points in one session. Something repriced before the payroll print and no reporting I can find named it. I would rather say so than invent a cause. The follow-through is in Fed rate cut odds for October 2026.
Three Books, One Question, and a 4.75 Point Gap
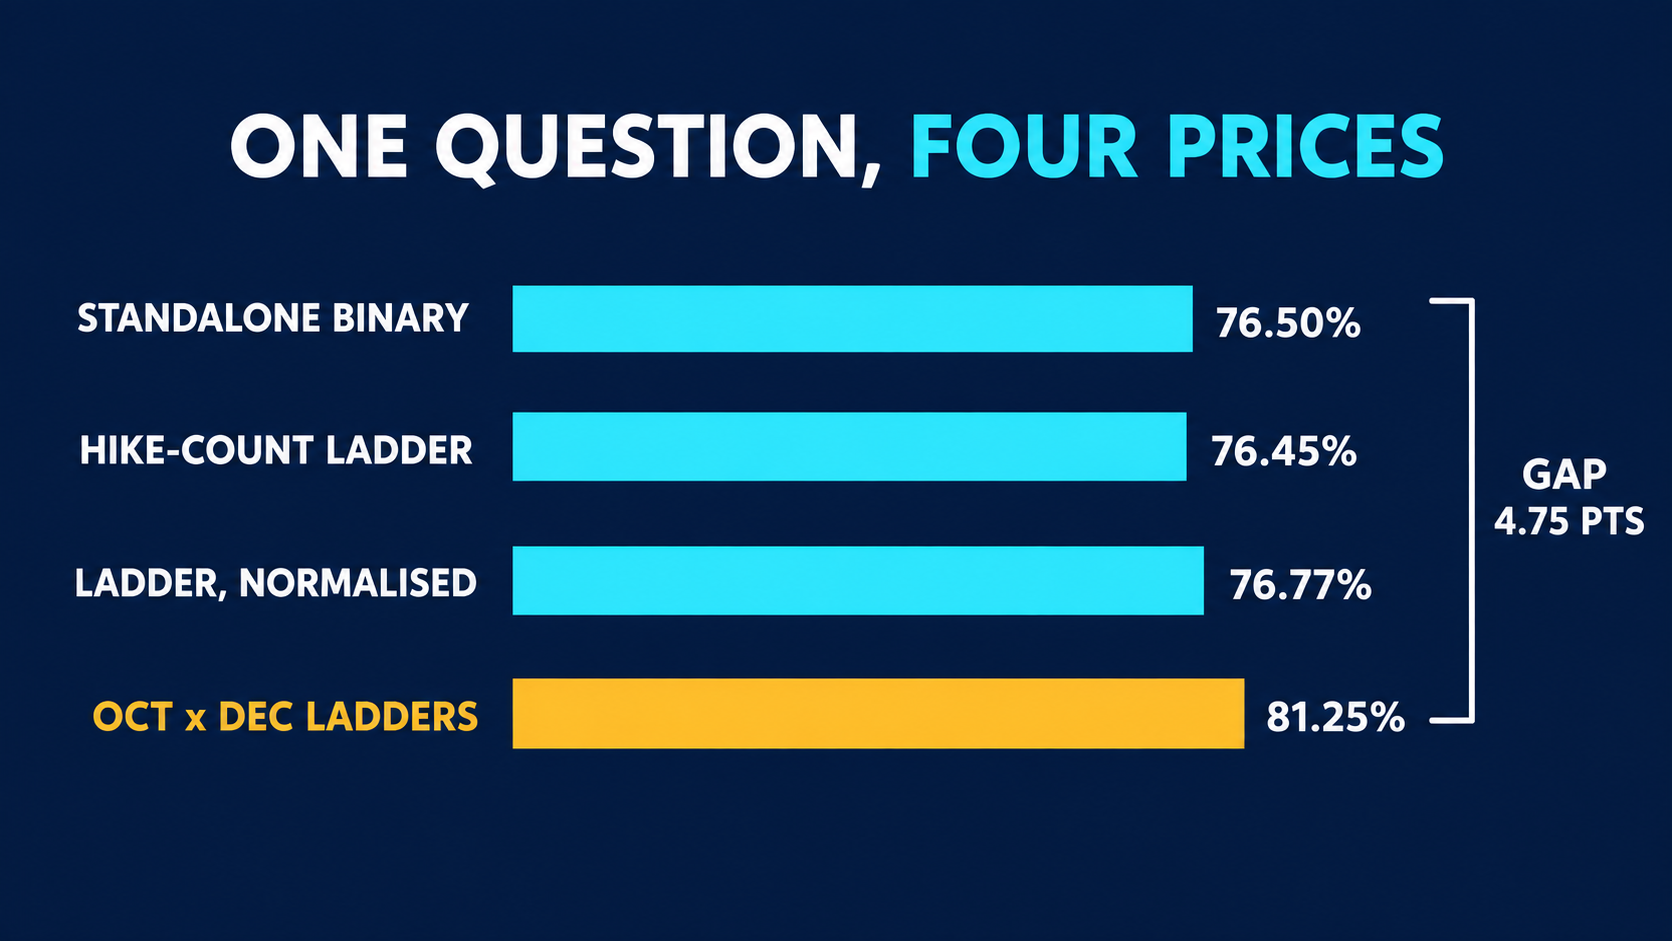
Polymarket prices the same question three different ways, and checking them against each other is the cheapest way to tell whether a price carries information or just carries flow. The question is simple: is there another hike in 2026?
| Book | Implied P(another hike in 2026) | Volume | Method |
|---|---|---|---|
| "Another Fed rate hike in 2026?" | 76.50% | $572k | Standalone binary, bid 76c / ask 77c |
| "How many Fed rate hikes in 2026?" | 76.45% | $878k | 1 minus P(0 hikes) minus P(1 hike), raw |
| Same ladder, normalised | 76.77% | $878k | Divided by the 101.4% ladder total |
| Oct and Dec decision ladders | 81.25% | $30.0m | 1 minus (1 - 0.1685) x (1 - 0.7745), independence assumed |
Polymarket events 1034268, 626860, 606422 and 770450, October 6, 2026 at 21:30 UTC. One hike has already happened this year, so "another hike" and "two or more hikes" are the same contract.
The two count books agree to within five basis points of probability, which is remarkable. 76.50% against 76.45% on two independently quoted contracts means the people trading them are doing the same arithmetic I just did.
The decision ladders are the odd ones out at 81.25%, and the gap is instructive rather than free money. Multiplying the two meetings assumes they are independent, and they are not: if the Fed hikes in October, December becomes a question about a *third* hike. Reconciling 81.25% down to 76.5% needs the two meetings positively correlated, which is hard to square with a committee guiding to one more move. Some of the gap is the 1.35% overround on the December ladder. The rest is a real wrinkle worth watching.
The Rate the Fed Sets Is Not the Rate That Prices Your Mortgage
Most people searching for the fed funds rate are really asking about a borrowing cost, and the fed funds rate is not it. It is an overnight rate between banks. Here is the gap between what the Fed controls and what the bond market charges.
| Instrument | Latest | Spread over funds upper bound | Who sets it |
|---|---|---|---|
| Fed funds target, upper bound | 4.00% | 0 bps | The FOMC, eight times a year |
| Effective fed funds rate | 3.88% | -12 bps | Overnight interbank trading |
| 2-year Treasury | 4.84% | +84 bps | Expectations of the funds path |
| 10-year Treasury | 5.31% | +131 bps | Growth, inflation and term premium |
| 10-year minus 2-year | +47 bps | Curve slope, positive and steepening |
FRED series DGS2 and DGS10 for October 5, 2026, the most recent settled curve. Treasury posts par yields after 15:30 Eastern, so an evening capture quotes the prior session.
The 10-year sits 131 basis points above the top of the Fed's range. That is the number that prices a 30-year mortgage, and it has been going the wrong way for a borrower even while the Fed spent 2025 cutting. A positively sloped curve with the long end at 5.31% is the bond market saying it expects this policy rate to stay high, or inflation to stay above target, or both.
If the mortgage question is the one you came with, the long end is where to look, and I went through the mechanics in the 10-year Treasury yield forecast. Cuts to the funds rate do not reliably pull mortgage rates down, and 2025 demonstrated it cleanly.
What Could Change It Before December 9
A 74.5% December hike is a strong view but not a settled one, and there is a specific amount of data left to change it. The committee meets October 27 to 28 with no projections, then December 8 to 9 with a full Summary of Economic Projections and a new dot plot.
- October 14: September CPI, the last inflation print before the October meeting.
- October 29: September personal income and outlays, which carries core PCE, the Fed's preferred gauge. It lands the morning *after* the October decision.
- November 6: the October employment report.
- November 10: October CPI, the last inflation reading the committee sees before December.
- December 4: the November employment report.
- December 8 to 9: the decision, plus the first new dot plot since September.
- December 10: November CPI, which arrives the day *after* the vote and cannot influence it.
So the December decision rests on two CPI prints and two employment reports, and the committee walks in without the November inflation number. That is a tighter information set than people assume, and it is why the December ladder has barely moved on individual data points while the October one collapsed.
What would genuinely reprice this is a core PCE print on October 29 confirming the downshift the BEA's annual revision produced, when core came in at 3.0% rather than the 3.3% the market had worked from. A Fed hiking into 3.0% core is a harder argument than one hiking into 3.4%, and the December book does not yet take that seriously. Workings in the core PCE inflation forecast; the calendar with dot-plot flags is on the FOMC schedule page.
My own read: the market is right that October is a hold and probably a little too confident about December. 74.5% on a meeting six weeks out, before two CPI prints, with the long end at 5.31% and payrolls averaging 45,000 a month, is priced as though the dot plot is a commitment. It is a forecast, and this committee has already changed direction once this year.
Frequently asked questions
What is the fed funds rate right now?
The FOMC target range for the federal funds rate is 3.75% to 4.00%, set on September 16, 2026 and effective September 17. The midpoint is 3.875%. The effective federal funds rate, which is what actually traded, printed 3.88% on October 5, 2026 on $121bn of volume.
What is the difference between the fed funds rate and the effective fed funds rate?
The target range is a policy decision by the FOMC. The effective federal funds rate, or EFFR, is a statistic: the volume-weighted median of actual overnight unsecured interbank borrowings, reported on the FR 2420 return and published by the New York Fed each business day at about 9:00am Eastern for the prior day. EFFR sits inside the range, currently at 3.88% against a 3.75% to 4.00% band.
Why does the Fed set a range instead of a single rate?
Because the post-2008 system has far more bank reserves than the old approach could manage. The Fed now runs a floor system: it pays interest on reserve balances, currently 3.90%, and that administered rate keeps market rates inside a 25 basis point band without the New York desk having to trade every morning to hit a point target.
Will the Fed raise rates at the October 2026 meeting?
The market says probably not. No change at the October 27 to 28 meeting prices at 82.5% on Polymarket and 83c to 84c on Kalshi, with a quarter point hike at 16.5% and 17c to 18c. October hike odds were 68.5% as recently as September 29 and fell 52 points after the September employment report.
What do markets expect the fed funds rate to be at the end of 2026?
Both venues imply a year-end midpoint of 4.10% to 4.11%, which means a 4.00% to 4.25% target range after one more quarter point hike. Polymarket's ladders give an expected change of 23.78 basis points and Kalshi's give 22.63. The Fed's own September 2026 median projection is 4.1%, so the market and the committee are within about a basis point of each other.
Is the Fed going to hike again in 2026?
Polymarket's standalone contract on another 2026 hike trades at 76.5%, and its hike-count ladder independently implies 76.45%. The central case on that ladder is two hikes for the full year at 66.5%, meaning the September move plus one more, most likely at the December 8 to 9 meeting, which prices at 74.5%.
When was the last time the Fed raised rates before September 2026?
July 27, 2023, when the target range reached its cycle peak of 5.25% to 5.50%. The Fed then held for 14 months, cut 175 basis points across six moves between September 2024 and December 2025 down to 3.50% to 3.75%, held for nine months, and raised to 3.75% to 4.00% on September 17, 2026.
Does the fed funds rate set mortgage rates?
No. Mortgages price off the long end of the Treasury curve, and the 10-year yield closed at 5.31% on October 5, 2026, which is 131 basis points above the top of the Fed's range. The Fed cut 175 basis points between 2024 and 2025 without pulling the 10-year down with it, so a lower funds rate does not reliably mean a cheaper mortgage.
Sources
- Federal Reserve, FOMC statement of September 16, 2026
- Federal Reserve, Summary of Economic Projections, September 16, 2026
- New York Fed, effective federal funds rate reference rate and methodology
- Federal Reserve, open market operations and target-range history
- US Treasury, daily par yield curve rates, 2026
- Bureau of Labor Statistics, CPI release schedule