Unemployment Rate Prediction 2026: 4.2% Holds

Every unemployment rate prediction I could find on the first page of Google is quoting a forecast that has already been revised. The top result is a staffing-firm post from December 2025 that cites the Philadelphia Fed at 4.5% for 2026 and puts the independent range at 4.4% to 4.8%. The Philadelphia Fed cut that number to 4.3% on August 14, and two of its own source links point at bare homepages with ChatGPT tracking tags still attached.
Here is the number instead. The official U-3 unemployment rate was 4.2% for September 2026, up a tenth from 4.1% in August. The 2026 high is 4.4% from February. Nine reports into the year, the entire range is three tenths of a point, which is about as flat as this series ever gets outside a turning point.
What nobody ranking for this term does is read the market's own forecast rather than an economist's. There are three live order books on this exact number, and they disagree in interesting ways. I pulled the Polymarket annual ladder, both of Kalshi's monthly ladders, the Fed's September 16 projections, the Philadelphia Fed's August survey and the full BLS series back to 1948, then computed the base rate for the precise question the contracts ask. The traded prices and the published forecasts are not describing the same risk.
Where the Unemployment Rate Actually Is Right Now
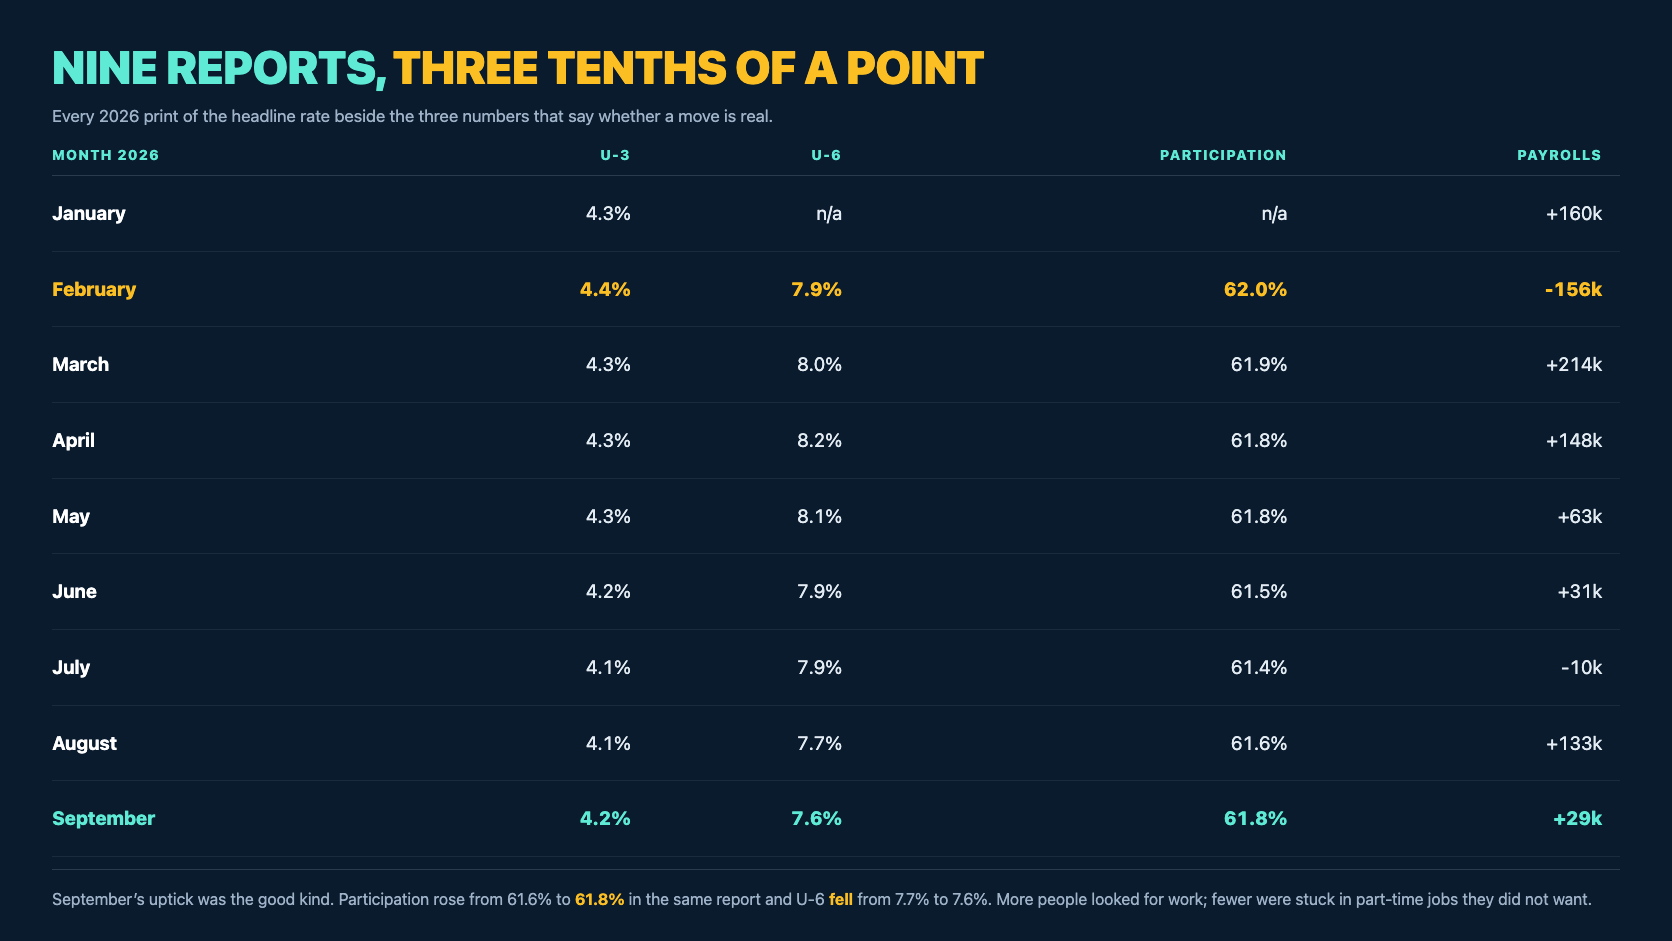
The table below is every 2026 print of the headline rate next to the three numbers that tell you whether a move is real: the broader U-6 measure, labor force participation, and the monthly change in payrolls. A rise in U-3 means something very different depending on which of those moved with it.
| Month 2026 | U-3 | U-6 | Participation | Payrolls |
|---|---|---|---|---|
| January | 4.3% | n/a | n/a | +160k |
| February | 4.4% | 7.9% | 62.0% | -156k |
| March | 4.3% | 8.0% | 61.9% | +214k |
| April | 4.3% | 8.2% | 61.8% | +148k |
| May | 4.3% | 8.1% | 61.8% | +63k |
| June | 4.2% | 7.9% | 61.5% | +31k |
| July | 4.1% | 7.9% | 61.4% | -10k |
| August | 4.1% | 7.7% | 61.6% | +133k |
| September | 4.2% | 7.6% | 61.8% | +29k |
Bureau of Labor Statistics, Employment Situation reports for January to September 2026, seasonally adjusted. U-6 counts the underemployed and marginally attached as well as the unemployed.
Read the September row across and the tick up to 4.2% stops looking like deterioration. Participation rose two tenths, from 61.6% to 61.8%, which puts more people in the denominator and in the job-search count. U-6 went the other way, down to 7.6%, its lowest reading of the year and six tenths below April's 8.2%.
That combination (headline rate up, participation up, underemployment down) is what a labor market absorbing returning workers looks like. It is not what the three months before a recession look like. Payrolls are the soft spot: the July to September average is +50,700 a month, against +141,000 across the first quarter.
What Polymarket Prices for the Rest of 2026
Polymarket runs one annual market, "How high will US unemployment go in 2026?", with about $563,000 of volume across five rungs. It resolves Yes on a rung if any Employment Situation report for a 2026 reference month shows U-3 at or above that level, read from Table A-15 to one decimal place.
That resolution detail matters more than it looks. Reports for January through September are already in the books and their high is 4.4%, so every rung at 4.5% or above now depends entirely on the October, November and December reference months. The December report does not publish until January 2027, which is why the market cannot resolve No before then.
| Rung (any 2026 month) | Price | Best bid / ask | Liquidity | Volume |
|---|---|---|---|---|
| 5.0% or higher | 4.85% | 4.8c / 4.9c | $6,759 | $155,377 |
| 5.5% or higher | 2.45% | 2.0c / 2.9c | $5,613 | $216,293 |
| 6.0% or higher | 0.30% | 0.2c / 0.4c | $6,950 | $100,832 |
| 7.0% or higher | 1.65% | 1.6c / 1.7c | $1,076 | $36,755 |
| 10.0% or higher | 1.85% | 1.0c / 2.7c | $609 | $53,986 |
Polymarket Gamma API, event 138976, pulled October 13, 2026. Prices are the mid quoted by the venue; liquidity is resting order book depth in US dollars.
The headline reading is the 5.0% rung at 4.85%, and it is the one rung on this ladder I would actually trust. It carries $155,000 of volume, nearly $6,800 of resting depth, and a one-tenth-of-a-cent spread. The rungs below it are a different story, and I come back to that in a moment.
Kalshi's October Book, Rung by Rung
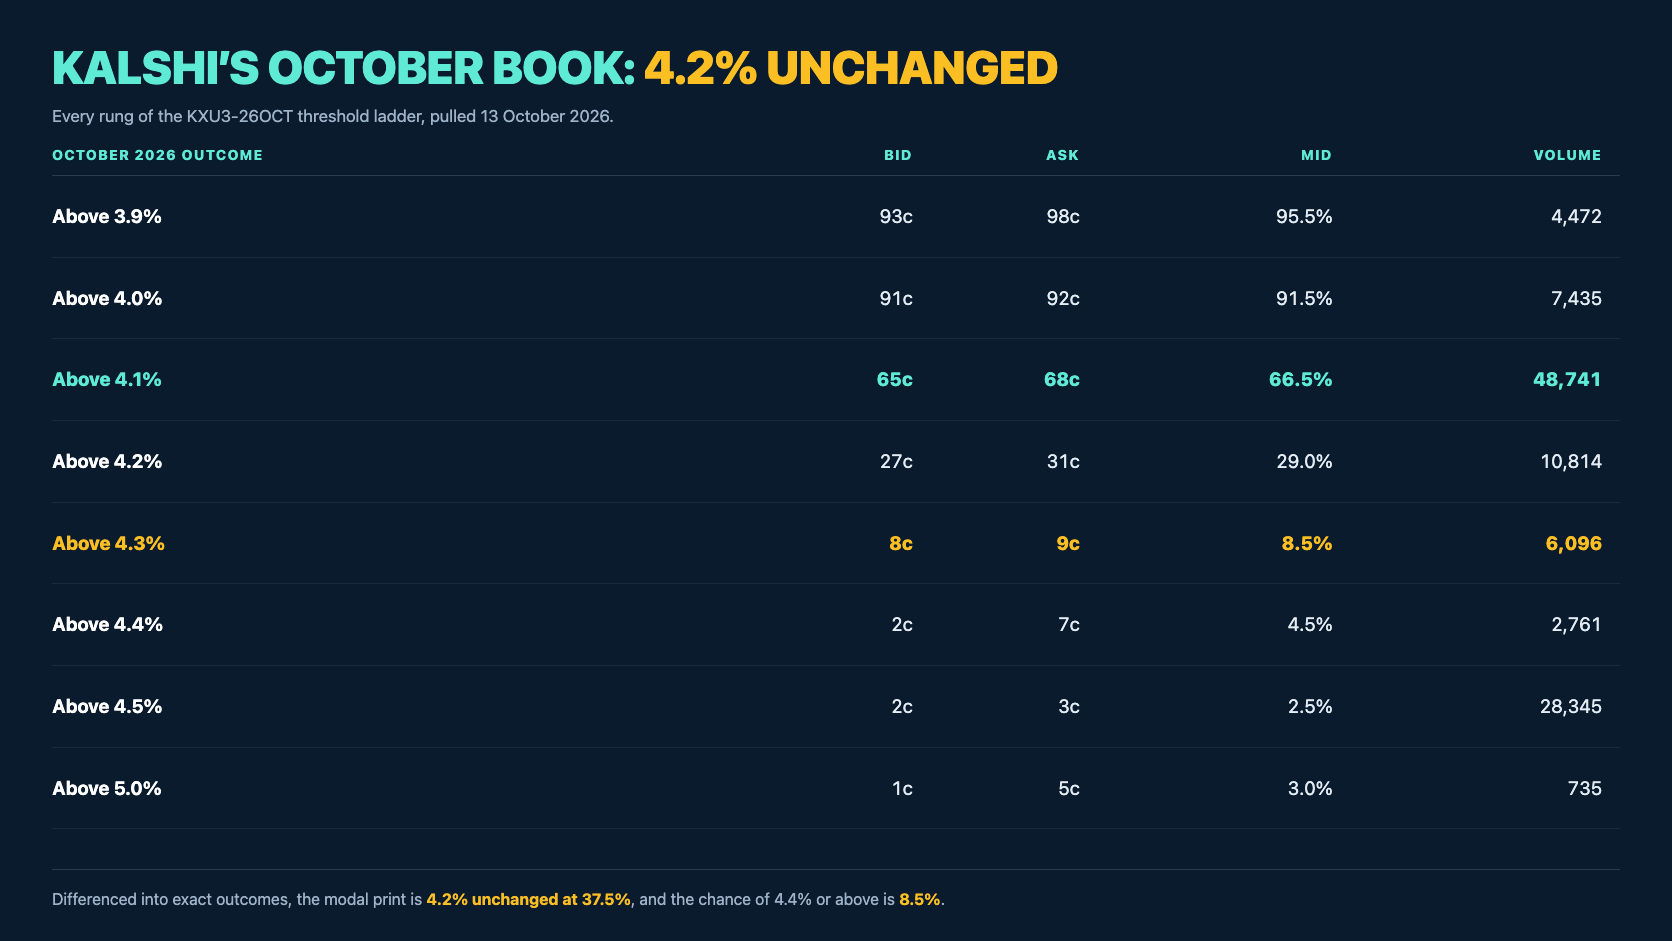
Kalshi is the better venue for this question because it lists the reference months separately. Its KXU3 series asks whether a given month comes in above a threshold, fourteen rungs per month, and the October book settles on the report due November 6. The October contracts have real two-sided markets where Polymarket has one annual bet.
| October 2026 outcome | Bid | Ask | Mid | Volume |
|---|---|---|---|---|
| Above 3.9% | 93c | 98c | 95.5% | 4,472 |
| Above 4.0% | 91c | 92c | 91.5% | 7,435 |
| Above 4.1% | 65c | 68c | 66.5% | 48,741 |
| Above 4.2% | 27c | 31c | 29.0% | 10,814 |
| Above 4.3% | 8c | 9c | 8.5% | 6,096 |
| Above 4.4% | 2c | 7c | 4.5% | 2,761 |
| Above 4.5% | 2c | 3c | 2.5% | 28,345 |
| Above 5.0% | 1c | 5c | 3.0% | 735 |
Kalshi KXU3-26OCT, pulled October 13, 2026. "Above 4.1%" resolves Yes at 4.2% or higher, because BLS reports U-3 to one decimal. Volume is contracts traded.
Subtract each rung from the one below it and the ladder becomes a distribution. The chance October prints exactly 4.2%, unchanged from September, is 66.5% minus 29.0%, or 37.5%. Exactly 4.3% is 20.5%, exactly 4.1% is 25.0%. Those three outcomes carry 83% of the probability between them.
The single most traded contract on the board is "Above 4.1%" at 48,741 contracts, which is the market concentrating its money on the one question that matters: does the rate stay at 4.2% or drift back to 4.1%. The most active rung in the last day was "Above 4.3%" with 1,093 contracts, and it sits at 8.5%.
Where Kalshi's Two Ladders Agree, and Where They Fall Apart
Kalshi lists a second unemployment series on the same reference month. KXECONSTATU3 pays out on an exact value ("Exactly 4.2%") across 23 rungs instead of a threshold. Two independent books on the same number is a free audit, so I ran it: the threshold differences should equal the exact-series prices.
| October outcome | Implied by thresholds | Exact-series mid | Gap |
|---|---|---|---|
| Exactly 4.0% | 4.0% | 8.5% | 4.5 pts |
| Exactly 4.1% | 25.0% | 26.5% | 1.5 pts |
| Exactly 4.2% | 37.5% | 37.5% | 0.0 pts |
| Exactly 4.3% | 20.5% | 21.0% | 0.5 pts |
| Exactly 4.4% | 4.0% | 6.5% | 2.5 pts |
Kalshi KXU3-26OCT threshold differences against KXECONSTATU3-26OCT bid/ask midpoints, both pulled October 13, 2026.
At the mode the two books agree to three decimal places. Both put exactly 4.2% at 37.5%, derived from completely separate order flow, and 4.3% is half a point apart. That is a market doing its job properly, and it is the strongest reason to believe the 4.1% to 4.3% cluster.
Two rungs out, the agreement dissolves. Exactly 4.0% is 4.0% one way and 8.5% the other, a gap wider than the number itself. The lesson generalises to every prediction market: price is only information where the volume is, and both of these books are thin past the second decimal of interest.
The Polymarket Tail Does Not Add Up
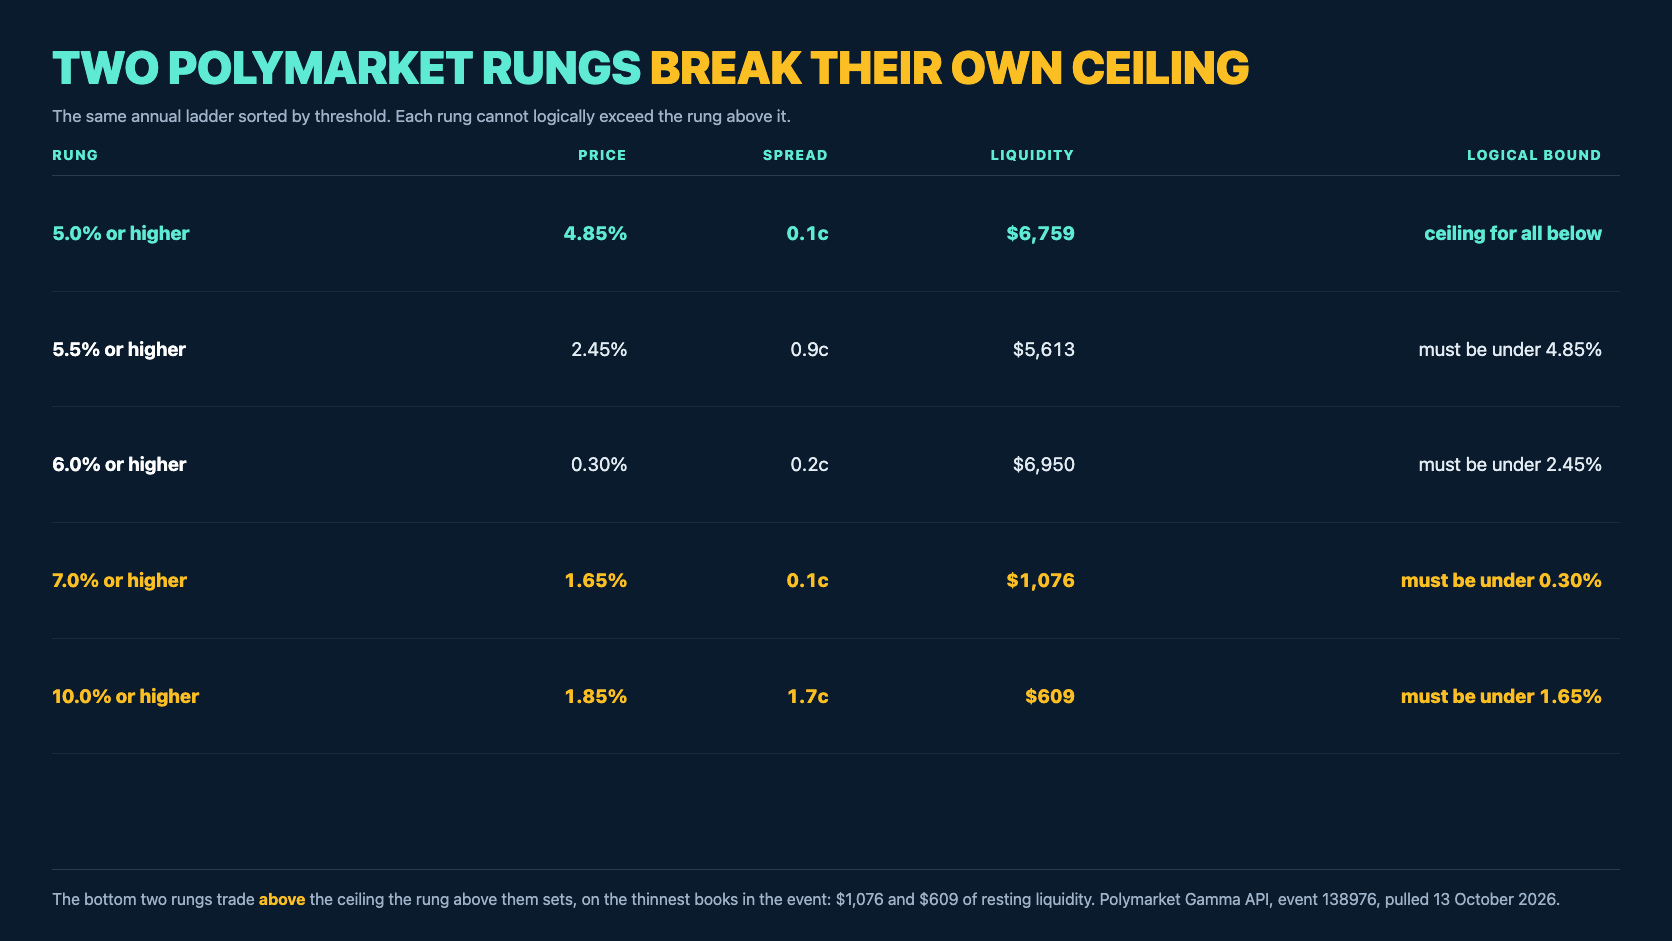
Go back to the Polymarket table and read the bottom three rungs in order. A 6.0% print is priced at 0.30%. A 7.0% print is priced at 1.65%. A 10.0% print is priced at 1.85%. Unemployment cannot reach 7% without passing through 6%, so the 7% rung is a strict subset of the 6% rung and must be cheaper. It is five times more expensive.
My first assumption was stale quotes on a dead rung, which is the usual explanation and would make the observation worthless. It does not hold here. The 6.0% market has $6,950 of resting liquidity and a two-tenths-of-a-cent spread; the 7.0% market has a one-tenth-of-a-cent spread. Both are tightly quoted, actively maintained, and mutually impossible.
| Rung | Price | Spread | Liquidity | Logical bound |
|---|---|---|---|---|
| 5.0%+ | 4.85% | 0.1c | $6,759 | ceiling for all below |
| 5.5%+ | 2.45% | 0.9c | $5,613 | must be under 4.85% |
| 6.0%+ | 0.30% | 0.2c | $6,950 | must be under 2.45% |
| 7.0%+ | 1.65% | 0.1c | $1,076 | must be under 0.30% |
| 10.0%+ | 1.85% | 1.7c | $609 | must be under 1.65% |
The same Polymarket ladder sorted by threshold. The last column is the arithmetic ceiling each rung inherits from the rung above it. The bottom two break it.
The practical takeaway is not a trade, it is a reading rule. Take the 5.0% rung at face value, because it is deep, tight and internally consistent with the 5.5% rung. Ignore the 6%, 7% and 10% rungs entirely. They are quoting noise, and any aggregator that scrapes this ladder and reports a "market-implied chance of 10% unemployment" is republishing a pricing error as a forecast.
What the Fed and 32 Professional Forecasters Say
Two published forecasts matter here, and both are more recent than anything the ranking pages cite. The Fed's Summary of Economic Projections came out on September 16, 2026, with eighteen participants submitting. The Philadelphia Fed's Survey of Professional Forecasters came out on August 14, 2026, with a panel of thirty-two.
| Source | 2026 | 2027 | 2028 | Note |
|---|---|---|---|---|
| Latest actual (September) | 4.2% | n/a | n/a | BLS Employment Situation |
| Fed SEP median | 4.1% | 4.1% | 4.1% | September 16, 2026 |
| Fed SEP central tendency | 4.1-4.2% | n/a | n/a | middle of 18 participants |
| Fed SEP full range | 4.0-4.3% | n/a | n/a | every participant, high to low |
| Philadelphia Fed SPF | 4.3% | 4.3% | 4.2% | annual average, 32 forecasters |
| SPF, previous survey | 4.4% | 4.5% | 4.4% | revised down in August |
Federal Reserve Summary of Economic Projections, September 16, 2026, and Federal Reserve Bank of Philadelphia Survey of Professional Forecasters, Third Quarter 2026.
The full-range row is the one to sit with. Of eighteen FOMC participants, each submitting their own forecast, not one projected 2026 unemployment above 4.3%. The highest individual projection on the committee is three tenths above where the rate sits today.
There is a measurement wrinkle worth being honest about. The SEP and SPF numbers are fourth-quarter or annual averages, while the contracts resolve on a single monthly print, and a monthly print can poke above a quarterly average without the average moving. That gap is real but small, and it does not come close to accounting for the distance between 4.3% and 5.0%. Our September dot plot breakdown walks through how the rest of the projection table has shifted this year.
How Often Unemployment Actually Jumps This Fast
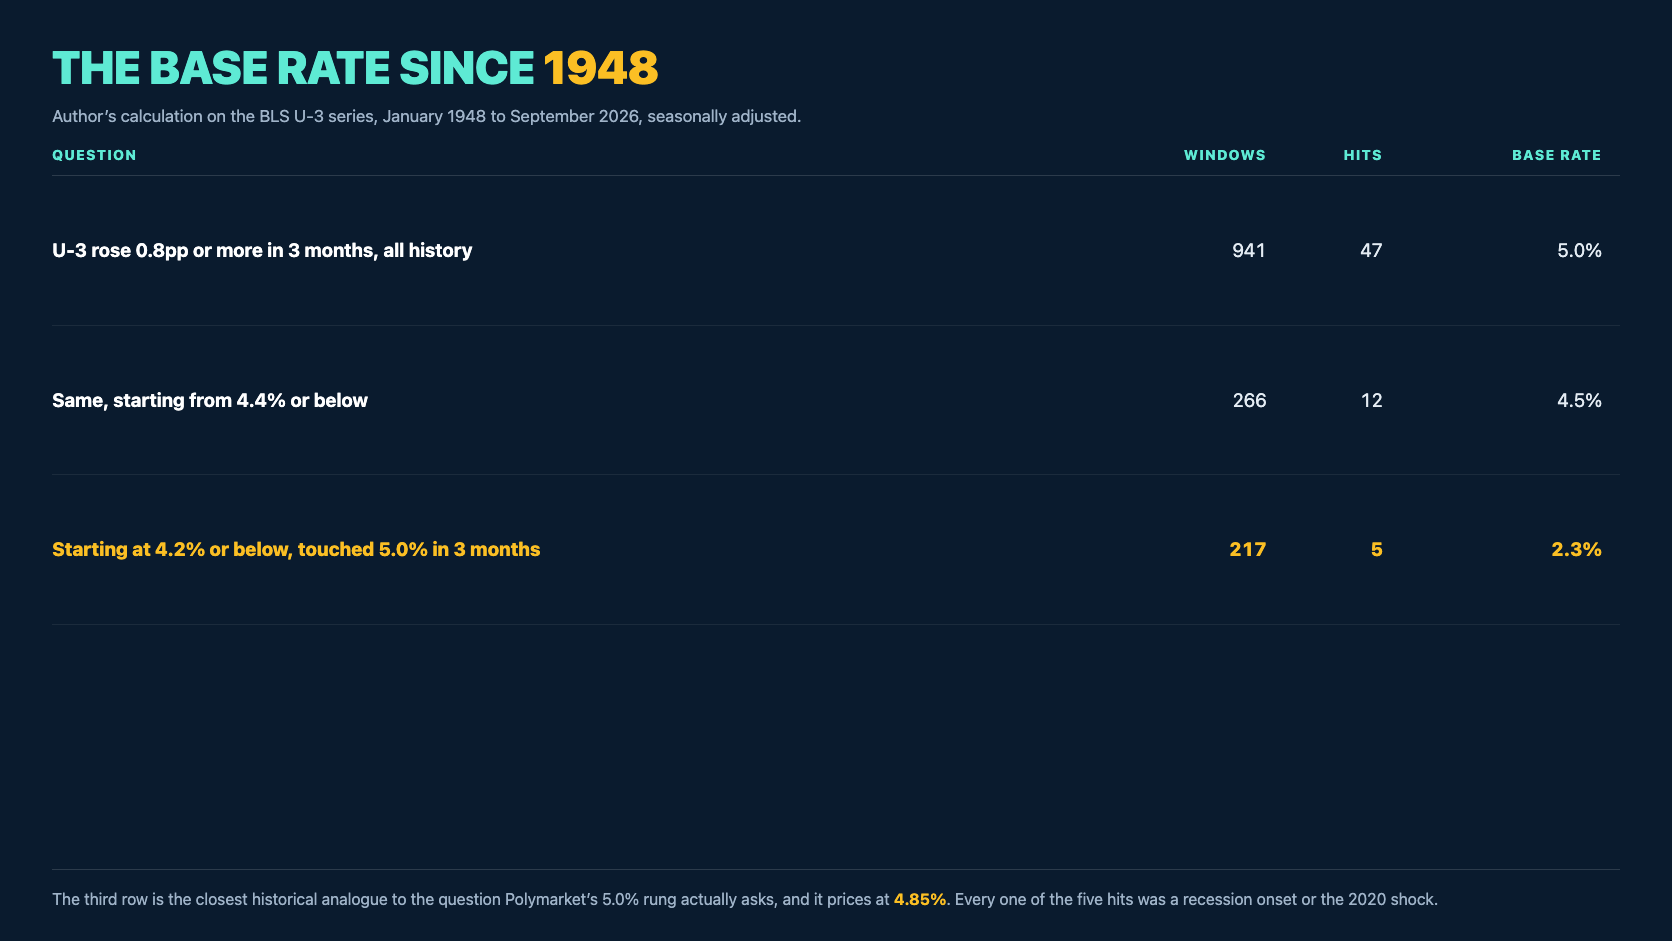
A probability is only meaningful next to a base rate, and I could not find one published anywhere for the question these contracts ask. So I computed it. I pulled the full BLS unemployment series, January 1948 to September 2026, which is 944 monthly observations and 941 rolling three-month windows, and counted.
| Question | Windows | Hits | Base rate |
|---|---|---|---|
| U-3 rose 0.8pp or more in 3 months (all history) | 941 | 47 | 5.0% |
| Same, starting from 4.4% or below | 266 | 12 | 4.5% |
| Starting at 4.2% or below, touched 5.0% in 3 months | 217 | 5 | 2.3% |
Author's calculation on the BLS U-3 series, January 1948 to September 2026, seasonally adjusted. The third row is the closest historical analogue to the Polymarket 5.0% rung with three reports left.
The bottom row is the contract. Starting from today's level or lower, unemployment reached 5.0% within three months five times in 217 chances, a base rate of 2.3%. Polymarket is asking 4.85%, roughly double the unconditional history.
The five episodes are the whole story: December 1948, November 1953, August 1957, January 2020 and February 2020. Three post-war recessions and the pandemic. There is no case in seventy-eight years of this series where the rate climbed 0.8 points in a quarter without a recession or a national shutdown underneath it.
What Would Have to Break to Get to 5%
Pricing a tail is more useful when you can name the mechanism. For U-3 to print 5.0% in the October, November or December reference month, one of a short list of things has to happen, and each leaves a mark in data you can watch before the report lands.
- Payrolls go negative and stay there. The July to September average is already only +50,700. Two consecutive prints near -200,000 would do most of the work on their own.
- Participation keeps climbing while hiring stalls. September added workers to the labor force. If that continues into a frozen hiring market, the rate rises without a single extra layoff.
- A sharp rise in permanent job losers rather than temporary layoffs. This is the composition change that preceded each of the five historical episodes above.
- A federal data disruption. The series already has a hole at October 2025, when no rate was published. A missing or delayed report changes what the contracts can settle on, not just the number.
None of those four is visible in the September data. That is not the same as saying they cannot happen in eight weeks, which is exactly the risk the 4.85% is paying for. It is a reminder that a 5% print is a regime change rather than a bad month, and regime changes announce themselves in payrolls first. Our September jobs report preview covers that series in detail.
How to Read These Markets Without Getting Fooled
Four rules came out of this exercise, and they apply to every macro contract on either venue, not just this one.
- Check the resolution source before the price. This market settles on U-3 from Table A-15, to one decimal. Not U-6, not the household survey's other measures, and not a revision published later.
- Read liquidity and spread next to every price. The 5.0% rung and the 10.0% rung sit on the same ladder and are not the same kind of number. One has $6,759 of depth, the other $609.
- Check the ladder against itself. Thresholds must fall as they rise. When they do not, as on the bottom of the Polymarket book, the price is not a forecast.
- Compare against a base rate you computed, not a vibe. The gap between 2.3% history and 4.85% market is the only part of this worth arguing about, and you cannot see it without doing the arithmetic.
On the actual question, I would take the market's word for the middle and my own for the tail. The 4.1% to 4.3% cluster is backed by two independent order books that agree to three decimals, eighteen FOMC participants whose entire range fits inside it, and thirty-two forecasters who just revised toward it. The 5.0% rung is priced at about double its historical frequency, which is normal for a tail that nobody wants to be short.
Frequently asked questions
What is the unemployment rate prediction for 2026?
The official U-3 rate was 4.2% in September 2026. The Fed's September projections put the 2026 median at 4.1%, the Philadelphia Fed's 32-forecaster panel puts the annual average at 4.3%, and Kalshi's October book makes 4.2% unchanged the single most likely outcome at 37.5%. Everything credible clusters in 4.1% to 4.3%.
Will unemployment hit 5% in 2026?
Prediction markets price it at about 4.85% on Polymarket, and that now depends entirely on the October, November and December reference months. The historical base rate for a move that fast from this level is 2.3%, so the market is asking roughly double the unconditional history for the risk.
Why did the unemployment rate go up in September 2026 if the labor market is fine?
Because the rise came from the supply side. Labor force participation rose from 61.6% to 61.8% in the same report, which adds job seekers to the count, while the broader U-6 underemployment rate fell from 7.7% to 7.6%. A rate that rises on more people entering the workforce is different from one that rises on layoffs.
What do the Fed's own projections say about unemployment?
The September 16, 2026 Summary of Economic Projections put the 2026 median at 4.1%, with a central tendency of 4.1% to 4.2%. The full range across all eighteen participants who submitted was 4.0% to 4.3%, so not one member of the committee projected 2026 unemployment above 4.3%.
Where can you bet on the unemployment rate?
Polymarket runs one annual market covering any 2026 reference month, with about $563,000 of volume. Kalshi lists two separate monthly series, KXU3 on thresholds and KXECONSTATU3 on exact values, for both October and November 2026. Kalshi's monthly books are considerably more liquid around the likely outcomes.
How does the unemployment market actually resolve?
Off the seasonally adjusted U-3 rate in Table A-15 of the BLS Employment Situation report, read to one decimal place. The October reference month settles on the report published November 6, 2026, and the December reference month is not published until January 2027, which is why the annual market cannot resolve No before then.
Is the Sahm rule signalling a recession right now?
No. The real-time Sahm rule indicator read 0.00 for September 2026 and was slightly negative in July and August. The rule flags recession risk when the three-month average of unemployment rises half a point above its prior-year low, so 0.50 is the trigger and the signal is nowhere near it.
Why do the Polymarket tail prices look wrong?
Because they are mutually inconsistent. The 6.0% rung is priced at 0.30% while the 7.0% rung is priced at 1.65%, and unemployment cannot reach 7% without first passing 6%. Both rungs carry spreads under a cent, so this is not a stale-quote artifact. Treat the deep 5.0% rung as the signal and disregard the rungs beneath it.